
Figure 6. Inhibition of drug resistance by TAP NPs.
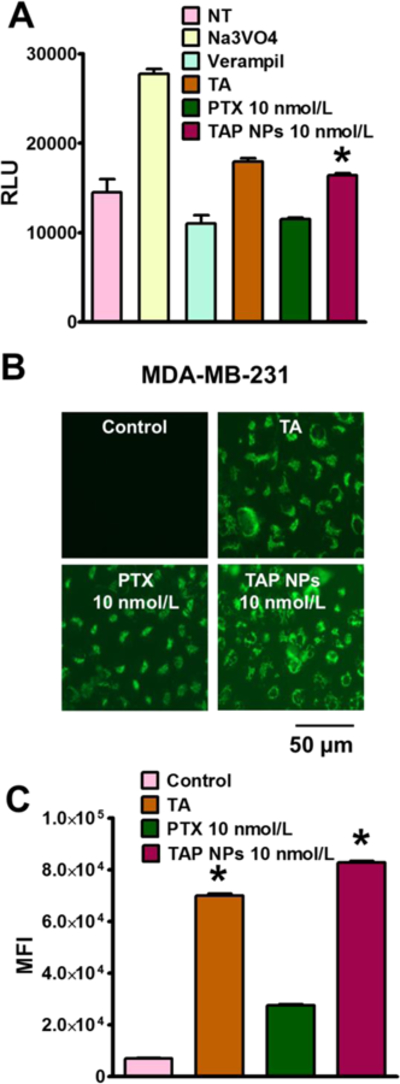
A) P-gp-Glo assay showing ATP consumption by different treatment groups having variation in average light units (RLU). Na3VO4 and Verapamil were negative and positive controls respectively, where higher ATP consumption signifies lower RLU. TAP NPs shows 1.42-fold higher RLU in contrast to native drug PTX, which is more effluxed out by the P-gp membranes. B) RH123 (2.62 µmol/L) dye shows higher accumulation in MDA-MB-231 cells after incubation for 30 min, when cells were treated for 48 hours with TAP NPs in contrast to PTX. TAP NPs exhibited significantly increased accumulation, suggesting TAP NPs prevent drug efflux. C) Mean fluorescence intensity in FL1 channel (488 excitation, Blue laser, 530 + 15 nm, FITC/GFP) was measured for different treatment groups. PTX 10 nmol/L treatment showed 3-fold lower intensity over TAP NPs (equivalent to 10 nmol/L PTX) which is probably because of higher efflux of PTX resulting in lower accumulation of RH123 (scale = 200 μm). Data presented as mean ± standard error of the mean (n = 3).