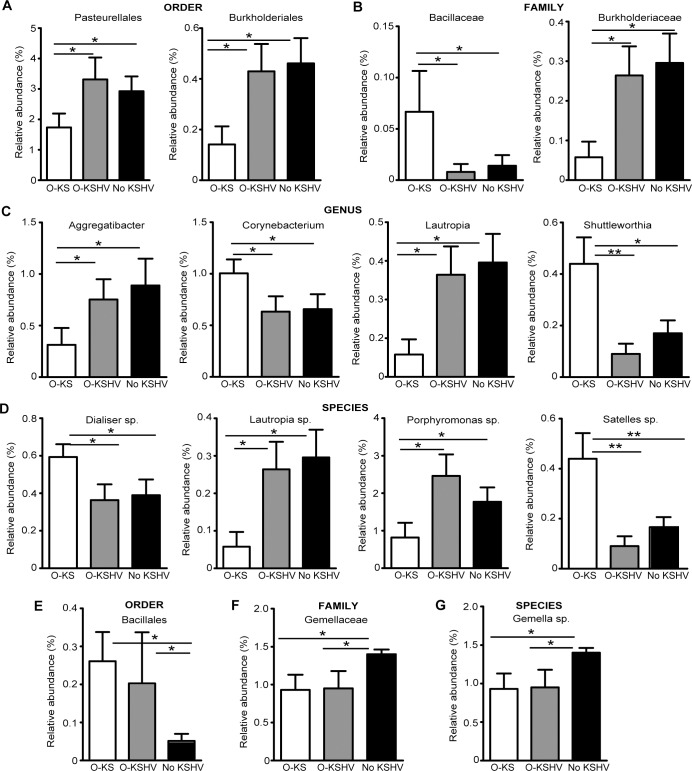
Fig 4. Alterations of oral microbiota in HIV/KSHV-coinfected individuals with oral cell-associated KSHV DNA or oral KS.
(A-D) Distinct signatures of O-KS group shown by relative abundances of OTUs at order level (A), family level (B), genus level (C) and species level (D). (E-G) Distinct signatures of No KSHV group shown by relative abundances of OTUs at order level (E), family level (F) and species level (G). Statistical analysis was performed using Student’s t-test with the GraphPad Prism software. Only significant results are represented.

