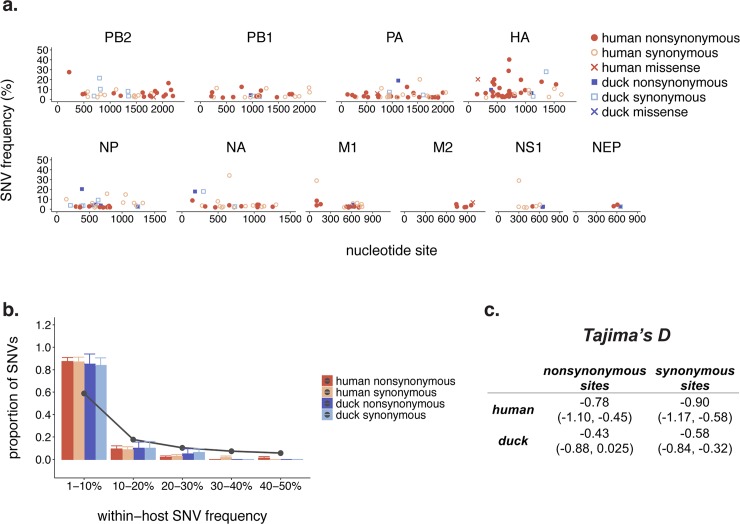
Fig 2. Within-host diversity in humans and ducks is dominated by low-frequency variation.
(a) Within-host polymorphisms present in at least 1% of sequencing reads were called in all human (red) and duck (blue) samples. Each dot represents one unique single nucleotide variant (SNV), the x-axis represents the nucleotide site of the SNV, and the y-axis represents its frequency within-host. (b) For each sample in our dataset, we calculated the proportion of its synonymous (light blue and light red) and nonsynonymous (dark blue and dark red) within-host variants present at frequencies of 1–10%, 10–20%, 20–30%, 30–40%, and 40–50%. We then took the mean across all human (red) or duck (blue) samples. Bars represent the mean proportion of variants present in a particular frequency bin and error bars represent standard error. Grey dots and connecting lines represent the expected proportion of variants in each bin under a neutral model. (c) We calculated Tajima’s D across the full genomes of humans and ducks, separately for synonymous and nonsynonymous sites. Values represent the mean Tajima’s D across all humans or ducks, and values in parentheses represent the 95% confidence interval.

