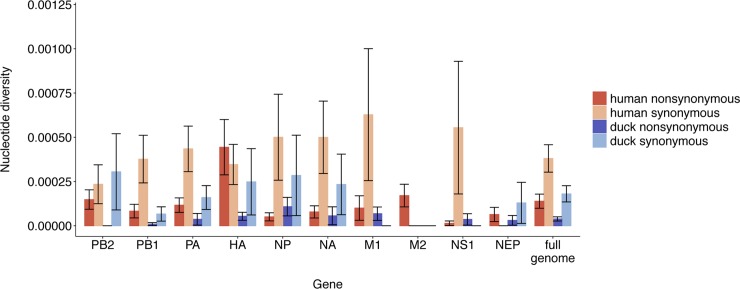
Fig 3. Purifying selection and genetic drift shape within-host diversity.
For each sample and gene, we computed the average number of pairwise nonsynonymous differences per nonsynonymous site (πN) and the average number of pairwise synonymous differences per synonymous site (πS). We then calculated the mean for each gene and species. Each bar represents the mean and error bars represent the standard error calculated by performing 10,000 bootstrap resamplings. Human values are shown in red and duck values are shown in blue.

