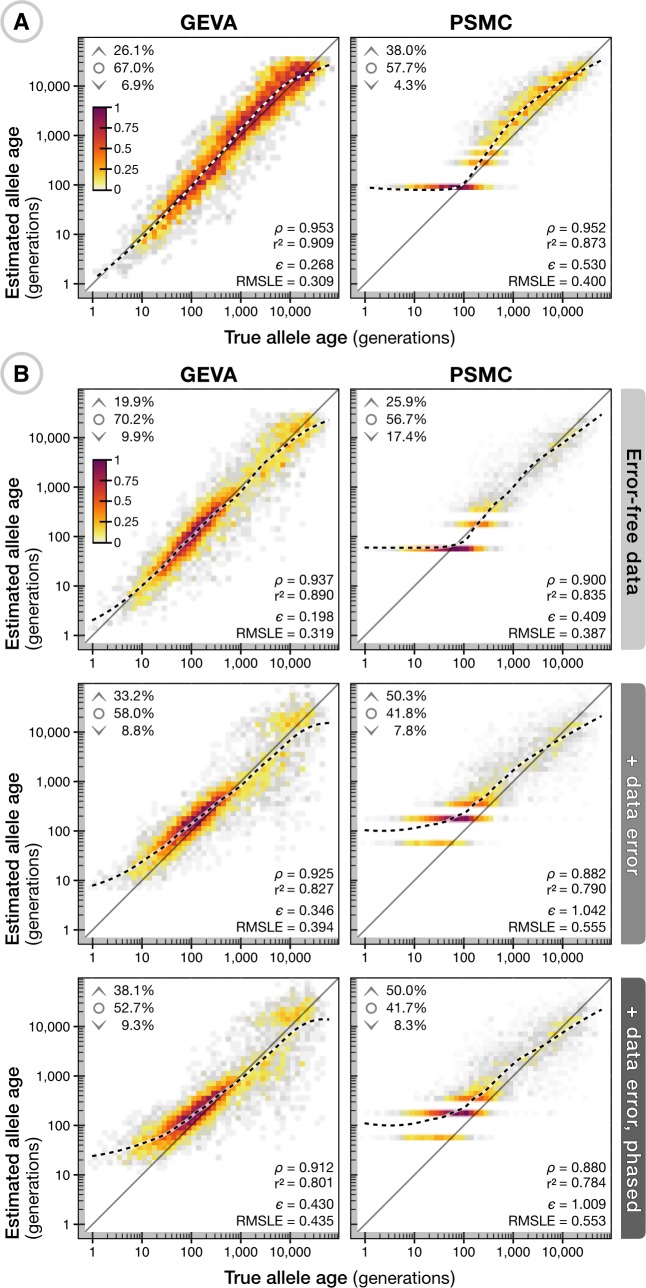
Fig 2. Validation of GEVA through coalescent simulations.
(A) Density scatterplots showing the relationship between true allele age (geometric mean of lower and upper age of the branch on which a mutation occurred; x axis) and estimated allele age (y axis), using GEVA with the in-built HMM methodology (left) and PSMC (right) for the same set of 5,000 variants. Data were simulated under a neutral coalescent model with sample size N = 1,000, effective population size Ne = 10,000, and with constant and equal rates of mutation (μ = 1 × 10⁻⁸) and recombination (r = 1 × 10⁻⁸) per site per generation. Variants were sampled uniformly from a 100-Mb chromosome, with allele count 1 < x < N. Colors indicate relative density (scaled by the maximum per panel). Upper inserts indicate the fraction of sites where the point estimate (mode of the composite posterior distribution) of allele age lies above the upper age of the branch on which it occurred (^), below the lower age (˅), or within the age range of the branch (∘). Lower inserts indicate the Spearman rank correlation statistic ρ, squared Pearson correlation coefficient (on log scale) r2, interval-adjusted bias metric (see S2 Text) ε, and RMSLE. Also shown is an LOESS fit (second-degree polynomials, neighborhood proportion α = 0.25; dashed line). (B) The relationship between true and inferred ages for 5,000 variants sampled uniformly from a simulation under a complex demographic model with N = 1,000, Ne = 7,300, μ = 2.35 × 10⁻⁸, and variable recombination rates from human chromosome 20 (63 Mb). Allele age was estimated on haplotype data as simulated and without error (top), with error generated from empirical estimates of sequencing errors (middle), and with additional error arising from in silico haplotype phasing; see S2 Text. Allele age was estimated using scaling parameters as specified for each simulation. A further breakdown of results using mutation and recombination clocks alone, as well as the inferred pairwise TMRCAs, is available for A (S1 Fig) and B (S2 Fig, S3 Fig, S4 Fig). GEVA, Genealogical Estimation of Variant Age; HMM, hidden Markov model; LOESS, locally estimated scatterplot smoothing; PSMC, pairwise sequentially Markovian coalescent; RMSLE, root mean-square log10 error; TMRCA, time to the most recent common ancestor.

