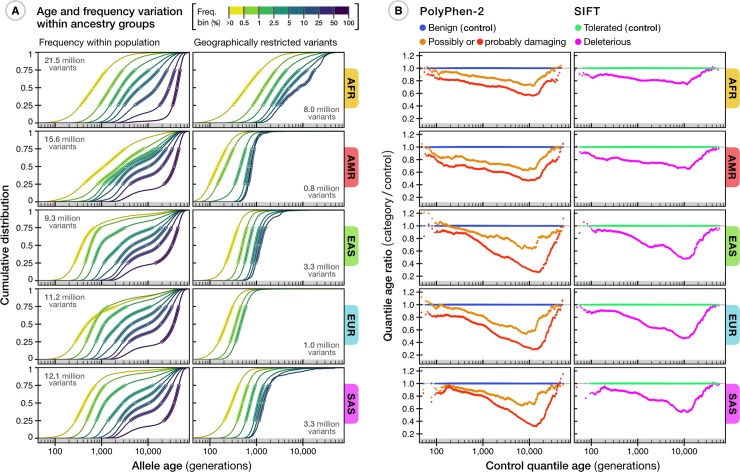
Fig 4. Age distribution of variants among different human populations.
(A) The relationship between estimated allele age and frequency as observed within a given population group in the TGP sample. Of the 45.4 million variants available in the Atlas of Variant Age, 43.2 million were dated using TGP data alone; we excluded variants with low estimation quality and inconsistent ancestral allele information (see S3 Text), retaining 34.4 million variants. Each line shows the cumulative age distribution of variants within a given frequency bin (see legend) within a population group; circles indicate median and interquartile range. Panels on the left show the frequency-stratified cumulative distribution of estimated age for variants at nonzero frequencies as observed within a given ancestry group. The number of variants available per group is shown (top left). Panels on the right show the distributions of geographically restricted variants that only segregate within a group (number of available variants shown on bottom right). A summary of variants shared between different ancestry groups in the TGP is provided in S6 Fig. (B) Differences in allele age distributions for approximately 70,000 variants in the TGP that are annotated as impacting protein function by PolyPhen-2 (left) and SIFT (right), compared to a reference set of variants (those annotated as benign by PolyPhen-2 or tolerated by SIFT), matched for allele frequency within a given ancestry group. These results are presented in more detail in S7 Fig. AFR, African; AMR, American; EAS, East Asian; EUR, European; PolyPhen-2, Polymorphism Phenotyping v2 software; SAS, South Asian; SIFT, Sorting Intolerant From Tolerant software; TGP, 1000 Genomes Project.

