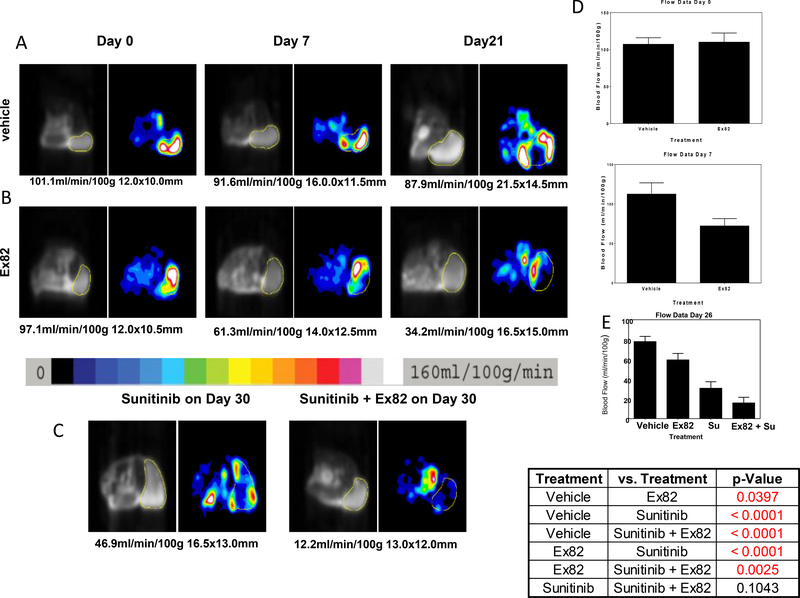
Figure 5. Combination S1P1 and VEGF pathway inhibition lowers tumor blood flow.
Arterial Spin Labeled Magnetic Resonance Imaging (ASL MRI) blood flow images are shown for tumors from mice treated serially with vehicle (A) or Ex82 (B) at day 0, day 7 and day 21. For each image pair, the black and white image is the MRI anatomic image and the corresponding colored image is the ASL image. The tumor is circled with a yellow line and the area in yellow is the region of interest for which the blood flow is measured. The color scale corresponds to tumor blood flow values. Below the color scale are 2 representative images of tumors from mice treated with sunitinib or sunitinib + Ex82 and imaged on day 26 (+/− 4 days depending on availability of MR scanner) (C). Statistical analysis is shown in the accompanying graphs (D, E) and Table (E), which shows the P values for differences in tumor blood flow at day 26.

