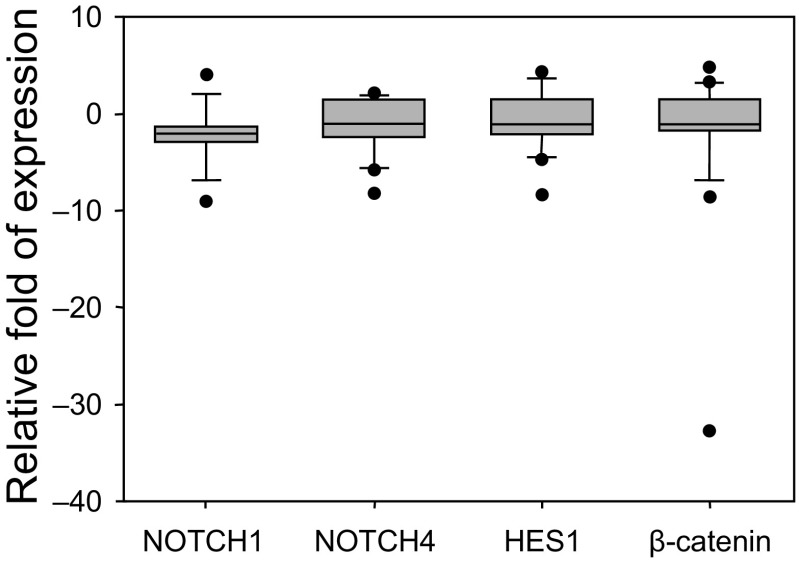
Fig. 3.
Relative expression of NOTCH1, NOTCH4, HES1, and β-catenin proteins in endometrioid adenocarcinoma
Relative expression of the protein in stage I endometrial adenocarcinoma tissue compared to the normal endometrium of the same patient. After densitometric analysis of the bands, which was performed with Image J software, the amount of Notch signalling protein was normalised to β-actin. The relative expression protein was calculated as the ratio of the protein amount in adenocarcinoma to that of the healthy tissue. The boundary of the box closest to zero indicates the 25th percentile, the line within the box marks the median, and the boundary of the box farthest from zero indicates the 75th percentile. The whiskers (error bars) above and below the box indicate the 90th and 10th percentiles

