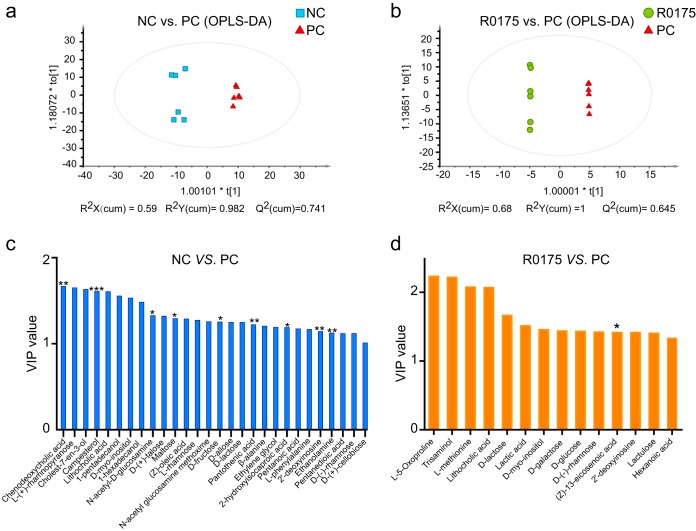
FIG 5.
Oral gavage of B. longum R0175 mitigated the changes in the metabolomic profile. (a and b) OPLS-DA plot comparing the NC and PC groups (a) and the PC and R0175 groups (b). Each dot represents one sample. (c and d) The bar charts show metabolites with a VIP value of >1 between the NC and PC groups (c) and between the PC and R0175 groups (d). The asterisk above the bar indicates the P value, as follows: *, P < 0.05; **, P < 0.01; ***, P < 0.001. cum, cumulative.

