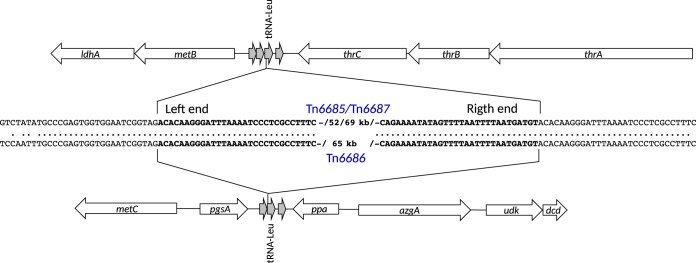
FIG 4.
Schematic drawing of the integration site of novel ICEs with an enhanced focus on the nucleotides in the flanking regions in the middle of the figure. Gray arrows represent tRNAs. Bold letters represent ICE ends. Dots represent homology between nucleotides. Repeats are in bold. Only 30 of the 66 nucleotides that perfectly directly repeat in the insertion region are shown in the figure.

