
Figure 2.
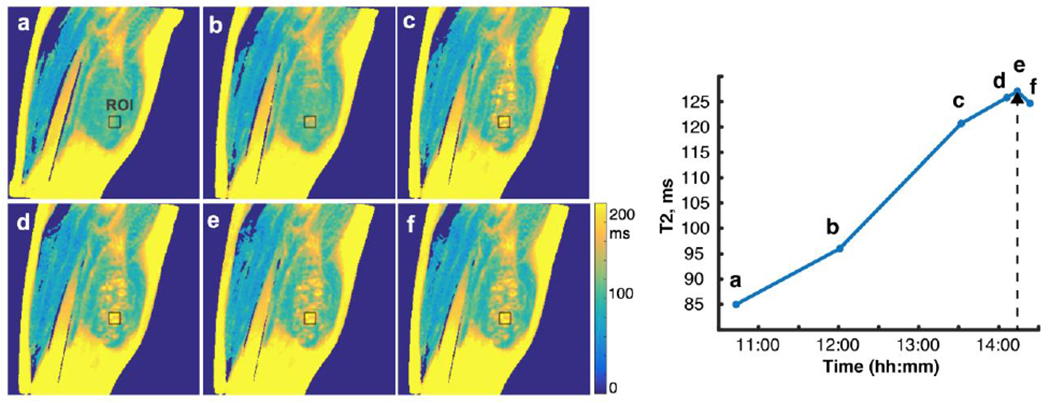
Sagittal T2 maps of one slice of the treatment region of patient 1. Fig. 2a demonstrates the tissue before sonication treatment. Figs. 2b through 2e demonstrate increased T2 value over the course of the treatment duration—four hours. 2f shows the T2 value approximately 20 minutes after treatment has ended. 2(right) is a quantification of this signal at the given ROI over time where the dotted arrowhead represents the final sonication treatment, just before point ‘e’. T2 maps were generated in MatLab.