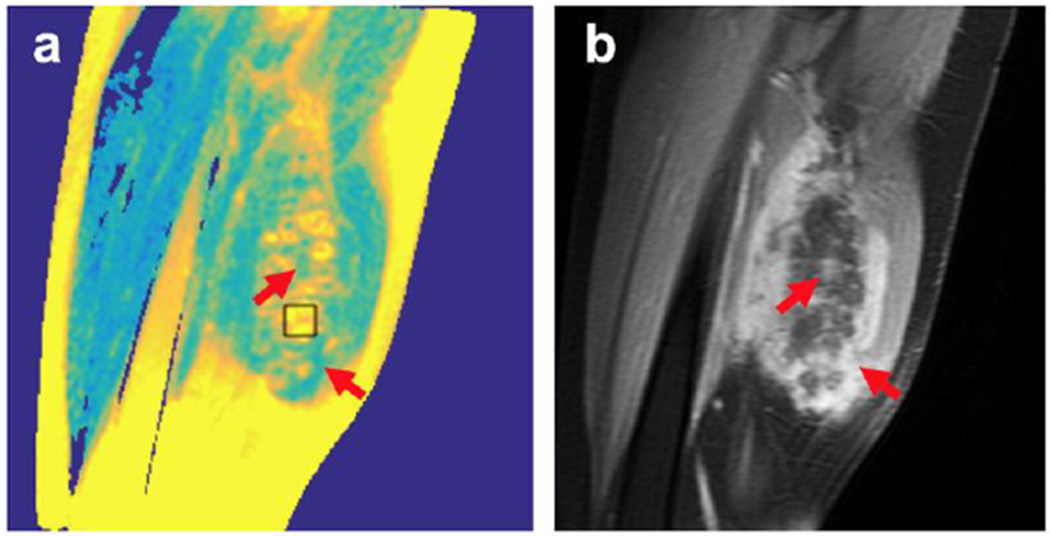
Figure 3.

Comparison of a sagittal T2 map (a) with post-treatment post-contrast image (b) of same location for patient 1. The non-perfused volume (NPV) appears hyperintense on T2 maps (example given by ROI box). Consequently, the red arrows identify gaps in the NPV, which correspond to high enhancement in the post-contrast images.
