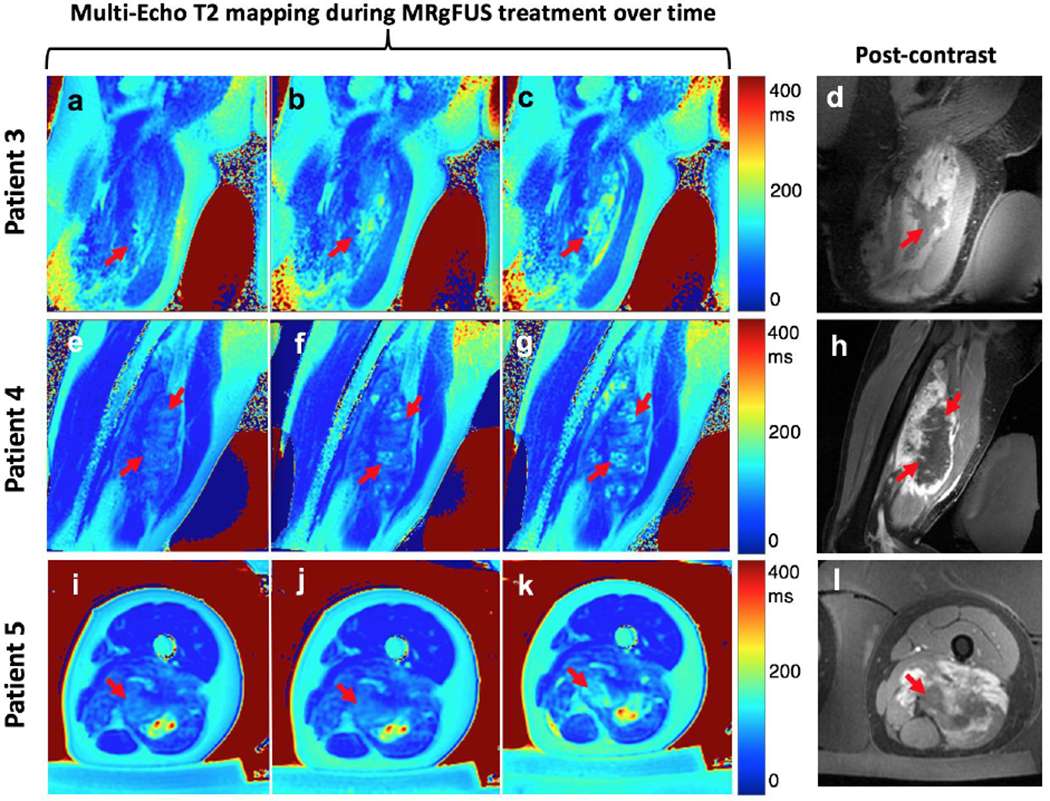
Figure 5.

Multi-slice T2 maps were generated (one slice shown). T2 maps for three additional patients are shown pre-sonication (first column: Fig. 5a, 5e, 5i), mid-sonication (second column: 5b, 5f, 5j) and end-sonication (final column: 5c, 5g, 5k). This set of final T2 maps is intended for comparison to Figs. 5d, 5h, 5l which demonstrate the corresponding post-contrast images.
