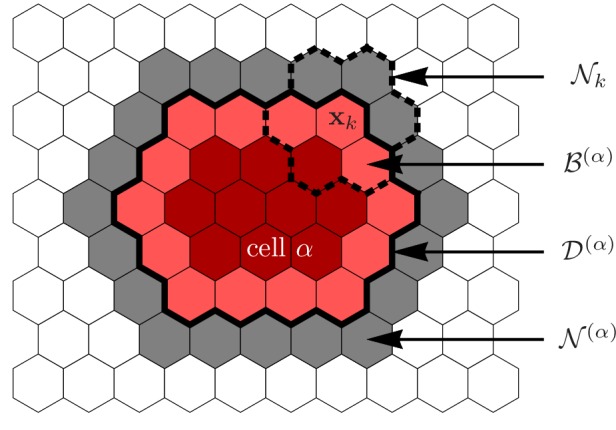
Appendix 1—figure 1. Illustration of the various sets defining a cell and its environment.

Grid sites occupied by cell , i.e. its domain , are indicated in red colors. The cell’s membrane sites, , are indicated by the lighter red color, the cell’s immediate neighborhood, , is indicated in gray. Elementary events involving cell always involve one grid site in and one grid site in . For the hexagonal lattices used in this work, each grid site is surrounded by nearest neighbors which we collectively denote by .
