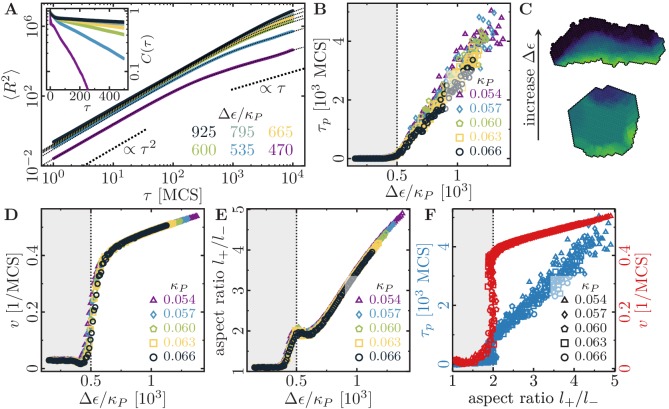
Figure 2. Cell shape and persistence of migration as a function of cell polarizability.
(A) Mean-squared displacement (MSD) for single-cell movements at different maximum cell polarity (stiffness parameters , ; average polarization field ; signaling radius ; cell-substrate dissipation ; cell-substrate adhesion penalty ; cytoskeletal update rate ; independent simulations for each set of parameters). Single cells perform a persistent random walk, i.e. they move ballistically () for , and diffusively () for . Inset: Normalized velocity auto-correlation function for the same parameters as in the main figure. (B) Persistence time of directed cell migration plotted as a function of maximum cell polarity , and perimeter stiffness (area stiffness ; average polarization field ; signaling radius ; cell-substrate dissipation ; cell-substrate adhesion penalty ; cytoskeletal update rate ; independent simulations for each set of parameters). The persistence time of the random walk increases with increasing cytoskeletal polarity and decreasing perimeter elasticity. (C) Cytoskeletal polarity also controls cell shapes, with crescent cell shapes (long persistence times) being observed at large cytoskeletal polartities, and round cell shapes (short persistence times) at small cytoskeletal polarities. Color code: cell polarization; cf. color bar in Figure 1C. (D) Single cell speed plotted as a function of maximum cell polarity , and perimeter stiffness . (E) Single cell aspect ratio plotted as a function of maximum cell polarity , and perimeter stiffness . (F) Speed and persistence time of single cells are correlated with the cell aspect ratio.


