. 2019 Dec 6;8:e46842. doi: 10.7554/eLife.46842

Figure 4. Phases of collective motion.

(4-cell systems; confinement radius r0=30.6; area stiffness κA=0.18; average polarization field ϵ0=225; signaling radius R=5; cytoskeletal update rate μ=0.1; cell-cell adhesion B=0; cell-cell dissipation ΔB=12; cell-substrate dissipation D=0; cell-substrate adhesion penalty φ=0 (r<r0), φ (r>r0); 100 independent simulations for each set of parameters). (A) Characteristic observables of collective cell rotation at different values of the cell perimeter stiffness parameter κP: mean (|ω|) and standard deviation (σω) of the magnitude of the cell cluster's angular velocity, and the standard deviation of the cell perimeter (σP). The statistics of collective cell motion depends only on the ratio of maximum cell polarity, Δϵ, to cell contractility, κP (specific polarizability). (B) Representative angular trajectories and (C) cell shapes (color code represents cell polarization; cf. Figure 1C) for the different parameter regimes as described in the main text. The cellular dynamics in the different parameter regimes are shown in Figure 4—video 1Figure 4—video 2 and Figure 4—video 3.
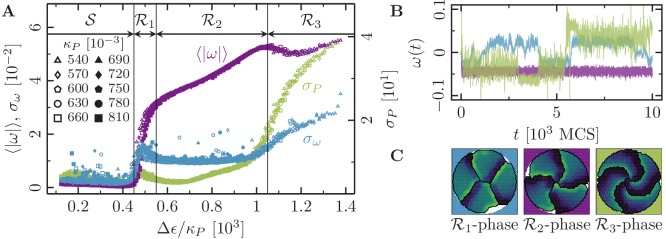
Figure 4.

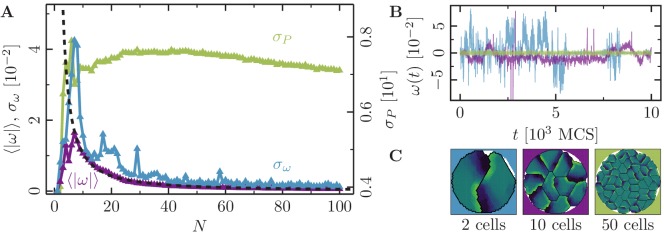
Figure 4—figure supplement 1. Collective motion for varying number of cells at low polarizability.

Figure 4—figure supplement 1.

(N-cell systems; confinement radius r0=234N; stiffness parameters κP=0.060, κA=0.18; average polarization field ϵ0=225; maximum cell polarity Δϵ=28; signaling radius R=5; cytoskeletal update rate μ=0.1; cell-cell adhesion B=0; cell-cell dissipation ΔB=12; cell-substrate dissipation D=0; cell-substrate adhesion penalty φ=0 (r<r0), φ- (r>r0); 100 independent simulations for each set of parameters). For this choice of parameters 4-cell populations rotate in the 1-phase. We observe a similar behavior here: the cell clusters rotate slowly and reorient frequently. (A) Characteristic observables of collective cell rotation at different values of the cell perimeter stiffness parameter κP: mean (|ω|) and standard deviation (σω) of the angular velocity magnitude of cell motion, and the standard deviation of the cell perimeter (σP). The black line corresponds to a power-law fit of the form |ω|N-k/2r0-k with the fitted exponent k8/3. (B) Representative angular trajectories and (C) cell shapes (color code represents cell polarization; cf. Figure 1) for the different parameter regimes as described in the main text. .
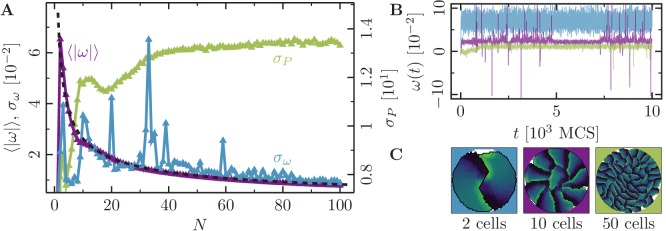
Figure 4—figure supplement 2. Collective motion for varying number of cells at intermediate polarizability.

Figure 4—figure supplement 2.

(N-cell systems; confinement radius r0=234N; stiffness parameters κP=0.060, κA=0.18; average polarization field ϵ0=225; maximum cell polarity Δϵ=50; signaling radius R=5; cytoskeletal update rate μ=0.1; cell-cell adhesion B=0; cell-cell dissipation ΔB=12; cell-substrate dissipation D=0; cell-substrate adhesion penalty φ=0 (r<r0), φ- (r>r0); 100 independent simulations for each set of parameters). For this choice of parameters 4-cell populations rotate in the 2-phase. We observe a similar behavior here: highly correlated rotations with no changes in rotational direction. (A) Characteristic observables of collective cell rotation at different values of the cell perimeter stiffness parameter κP: mean (|ω|) and standard deviation (σω) of the angular velocity magnitude of cell motion, and the standard deviation of the cell perimeter (σP). The black line corresponds to a power-law fit of the form |ω|N-1/2r0-1. (B) Representative angular trajectories and (C) cell shapes (color code represents cell polarization; cf. Figure 1) for the different parameter regimes as described in the main text. .
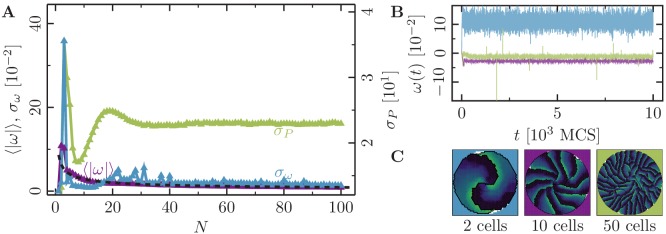
Figure 4—figure supplement 3. Collective motion for varying number of cells at high polarizability.

Figure 4—figure supplement 3.

(N-cell systems; confinement radius r0=234N; stiffness parameters κP=0.060, κA=0.18; average polarization field ϵ0=225; maximum cell polarity Δϵ=70; signaling radius R=5; cytoskeletal update rate μ=0.1; cell-cell adhesion B=0; cell-cell dissipation ΔB=12; cell-substrate dissipation D=0; cell-substrate adhesion penalty φ=0 (r<r0), φ- (r>r0); 100 independent simulations for each set of parameters). For this choice of parameters 4-cell populations rotate in the 3-phase. We observe a similar behavior here: highly correlated rotations. (A) Characteristic observables of collective cell rotation at different values of the cell perimeter stiffness parameter κP: mean (|ω|) and standard deviation (σω) of the angular velocity magnitude of cell motion, and the standard deviation of the cell perimeter (σP). The black line corresponds to a power-law fit of the form |ω|N-1/2r0-1. (B) Representative angular trajectories and (C) cell shapes (color code represents cell polarization; cf. Figure 1) for the different parameter regimes as described in the main text.
Figure 4—video 1. Collective rotations of 4 cells in the 1-phase (Δϵ=28Δϵ/κP=467).
Download video file (15.8MB, mp4)
Figure 4—video 2. Collective rotations of 4 cells in the 2-phase (Δϵ=50Δϵ/κP=833).
Download video file (18.6MB, mp4)
Figure 4—video 3. Collective rotations of 4 cells in the 3-phase (Δϵ=70Δϵ/κP=1167).
Download video file (18.8MB, mp4)