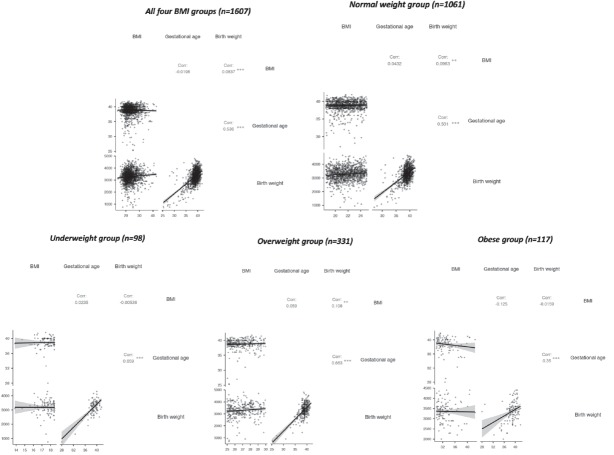
Figure 3.
Correlation graphs for BMI, gestational age and birth weight. Top: correlation matrix for the entire pregnant population (left) and normal weight subgroup (right); Bottom: correlation matrix for the underweight (left), overweight (centre) and obese (right) groups; Note * p<0.05, ** p<0.01, *** p<0.001. BMI - body mass index.

