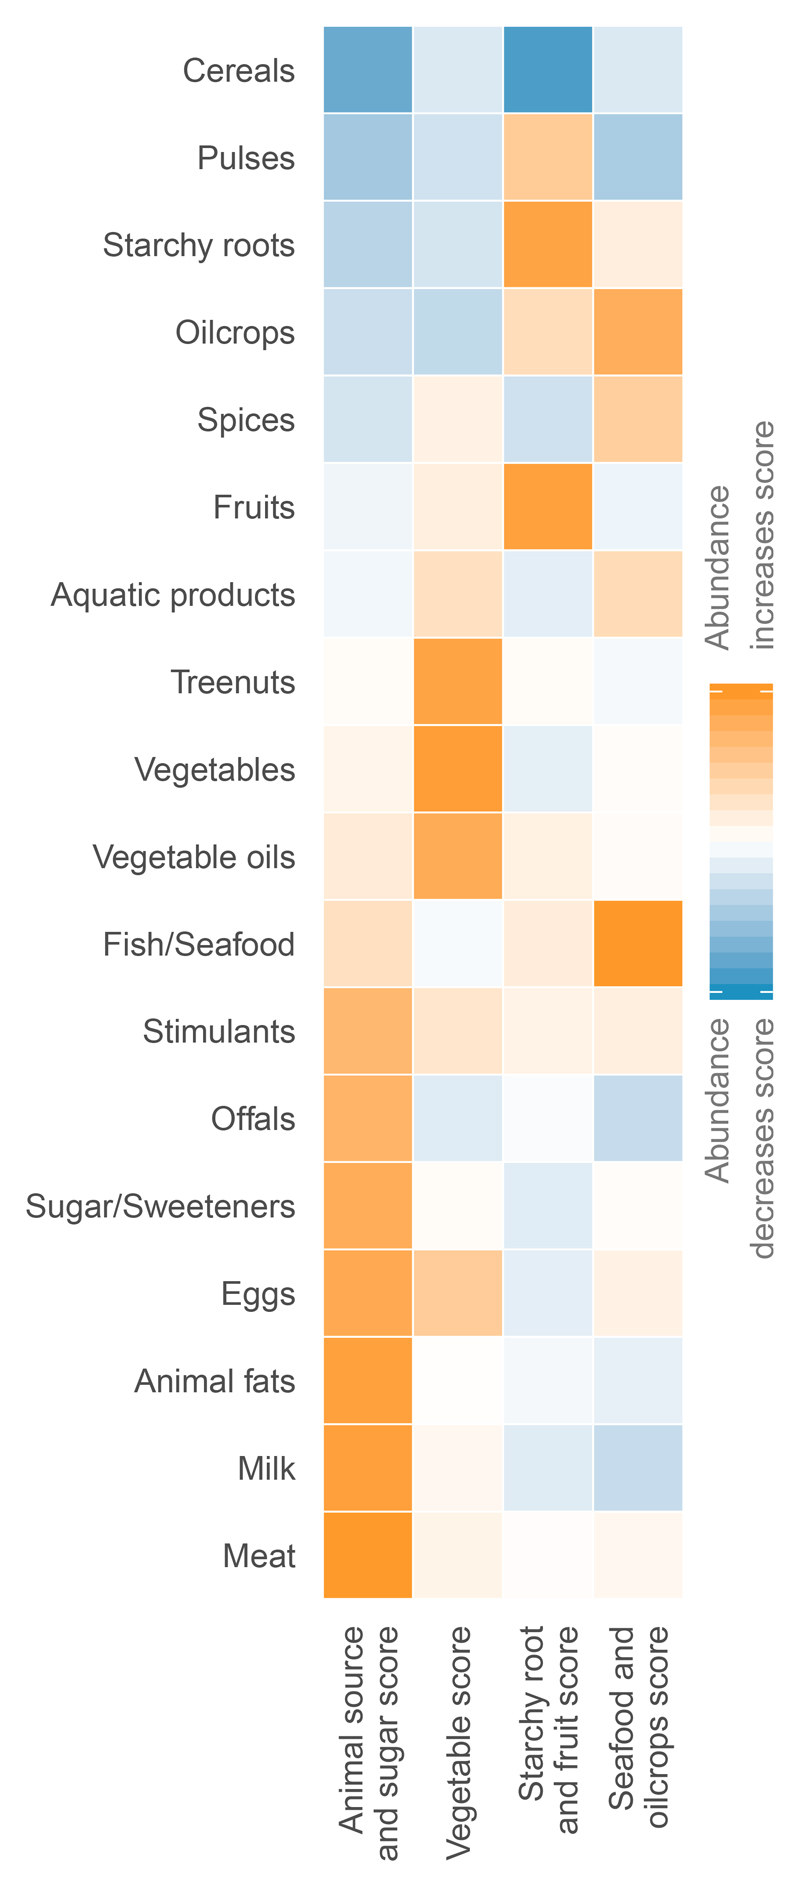
Figure 1. Loadings of each food group for the four food supply scores.
Warm colours indicate that abundance of a food type as a component of total energy from food supply increases the scores and absence decreases the scores; cold colours indicate that absence increases the scores and abundance decreases the scores.

