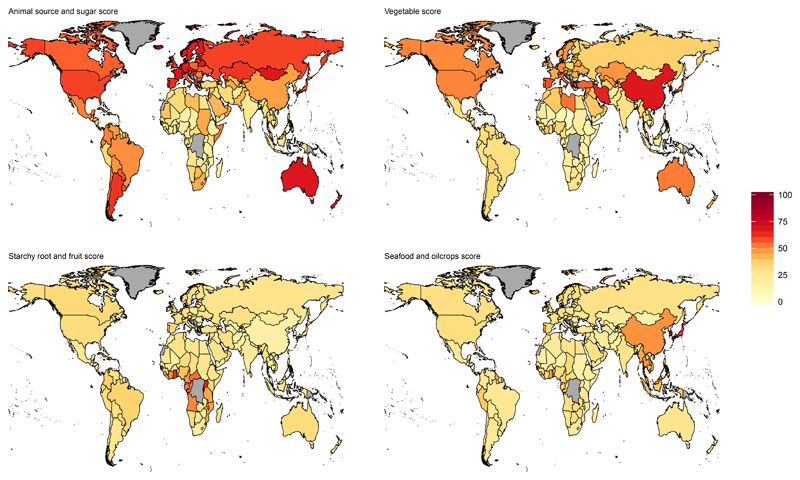
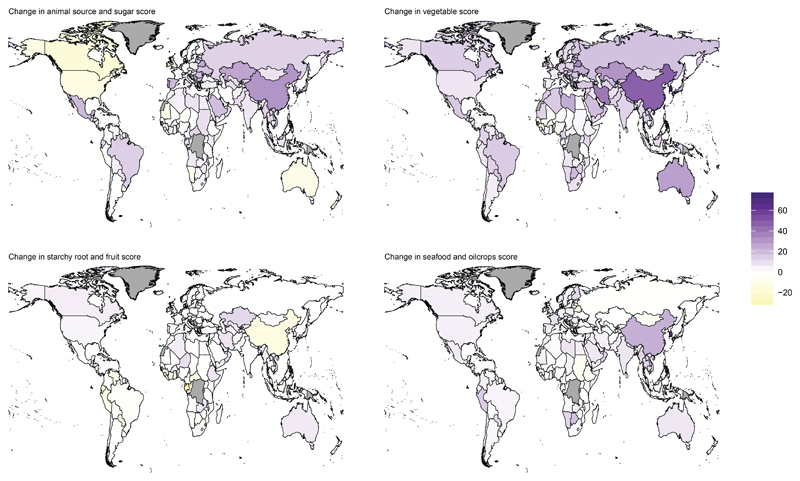
Figure 2. Mean food supply scores by country.
Scores by country for the period 2009-2013 (panel A) and change from 1961-1965 to 2009-2013 (panel B). Countries shown in grey had no data. As described in Methods, the scores are presented on a scale of 0 to 100, with 0 representing the lowest value observed in any country from 1961 to 2013, and 100 the highest.


