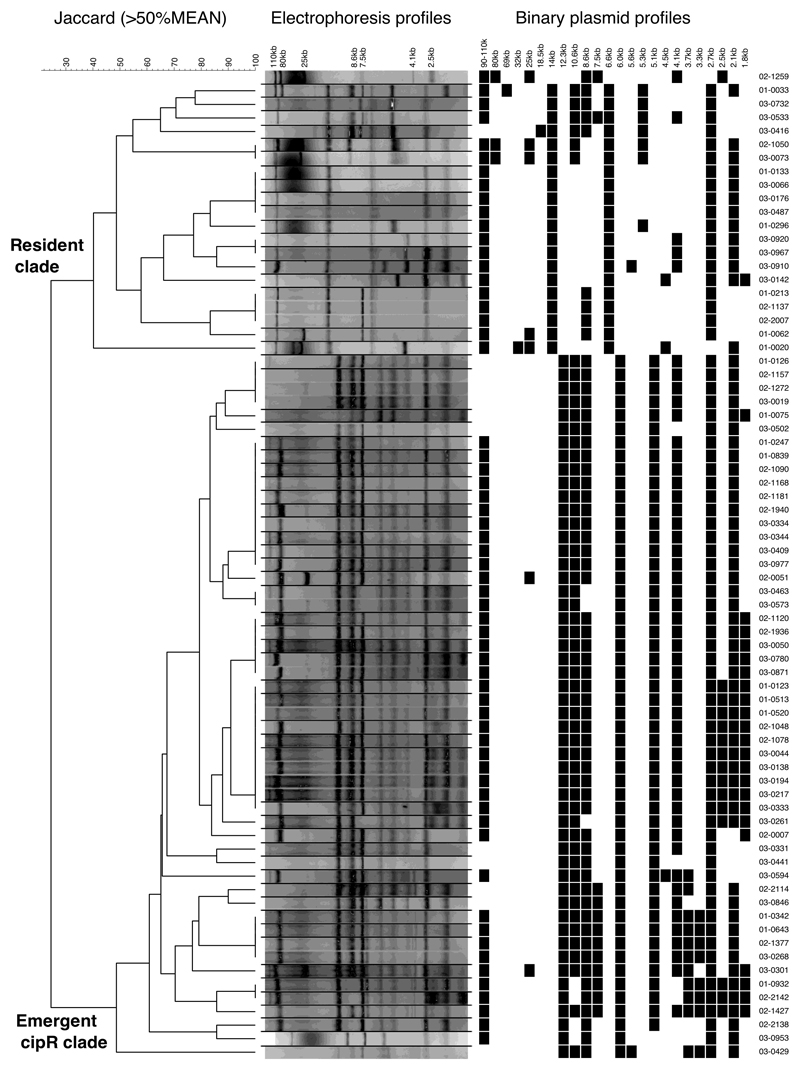
Extended Data Figure 1. Plasmid profiling of Shigella sonnei in Vietnam, 2014-2016.
Dendrogram shows the difference in plasmid electrophoresis patterns between the resident S. sonnei clade and the cipR S. sonnei clade in Vietnam. Black lines separate lanes that were not contiguous in a gel. Data were obtained from a single experiment. Cluster analysis was performed with Bionumerics by using the Jaccard coefficient and the unweighted pair group mathematical average (UPGMA) clustering algorithm.

