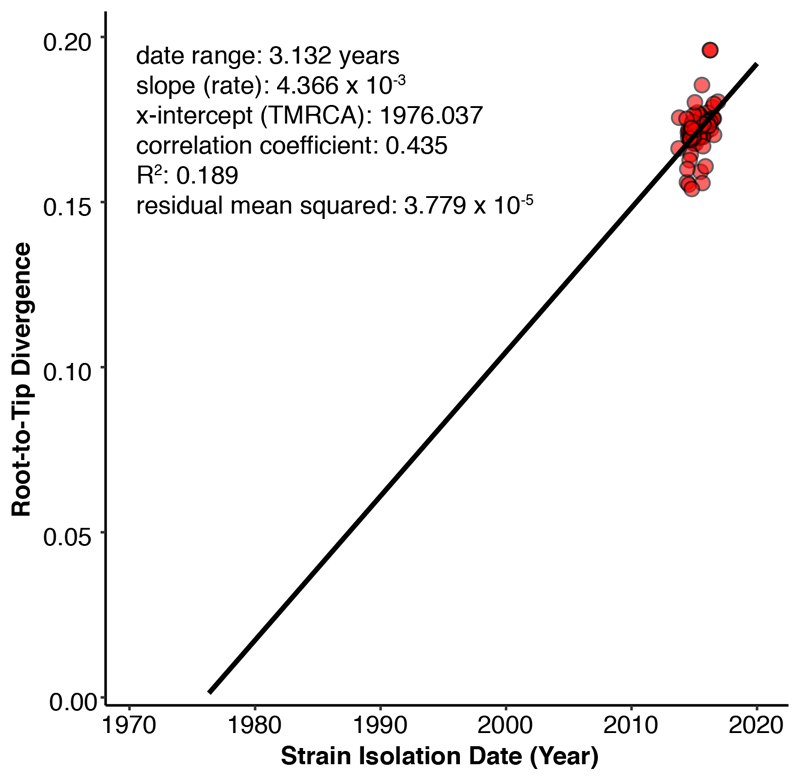
Extended Data Figure 3. Root-to-tip regression for the maximum likelihood tree of Shigella sonnei in Vietnam, 2014-2016.
Each point on the plot corresponds to a measurement of genetic distance from the inferred root to each tip in the tree (n = 81 biologically independent samples). The solid line is the regression line fitted using the ordinary least squares method. The slope of the line is a crude estimate of the evolutionary rate, the x-intercept corresponds to the inferred date of the most recent common ancestor, and the R2 value measures the degree of clock-like behavior.

