FIGURE 6.

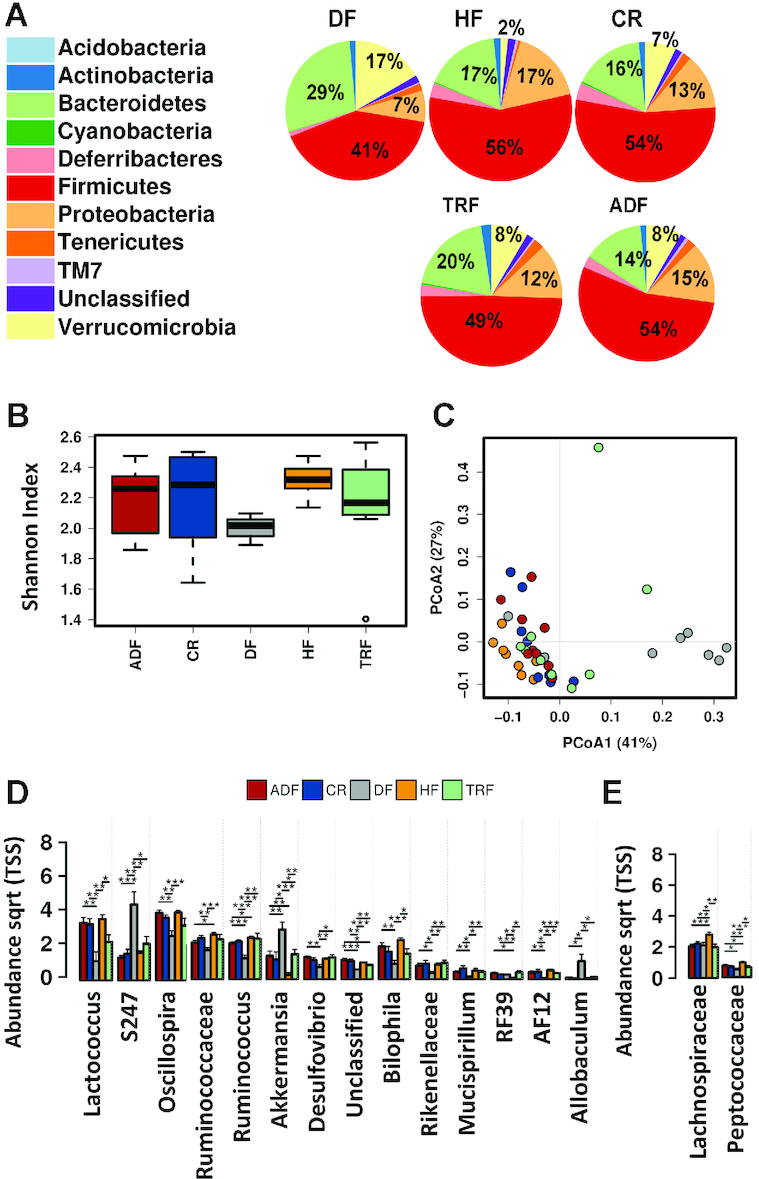
Cecal microbiome composition following intervention. (A) Pie chart showing relative abundance of cecal microbiota taxonomic composition for animals on various dietary modifications. (B) α-Diversity as measured by Shannon index of the cecal microbiome (genus level) for all dietary modifications. Whisker plots show mean surrounded by the upper and lower quartiles. Lines show variability outside of the quartiles. (C) Predicted β-diversity as shown by a PCoA plot (Bray–Curtis, genus level) of the cecal microbiome demonstrates that all HF-fed groups, irrespective of fasting time, clustered and are distinct from the DF group. (D) Bar chart showing abundance of specific populations (genus level) that are altered by dietary composition specifically. (E) Bar chart showing abundance of indicated populations that is altered by fasting protocols. Significance (*P < 0.05;**P <0.01;***P< 0.05) determined by ANOVA. ADF, alternate-day fasting; CR, caloric-restricted; DF, Daniel Fast; HF, high-fat diet; PCoA, principal components analysis; Sqtr, square toot; TRF, time-restricted feeding; TSS, total sum scaling.
