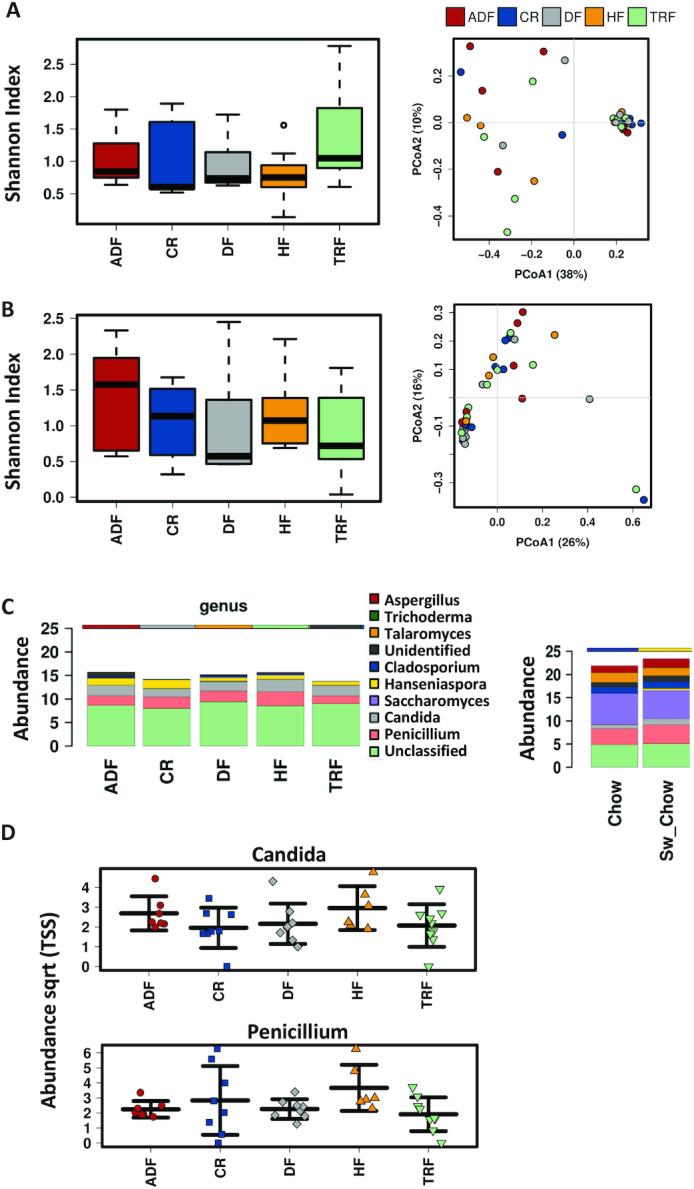
FIGURE 8.

Fungal composition following dietary intervention in cecal and fecal samples. Diversity of fungal samples (operational taxonomic unit level); α-diversity as demonstrated by box plots and Shannon index (left panel). Predicted PCoA plots based on Jaccard analysis showing β-diversity (right panel) from (A) cecal and (B) fecal samples. (C) Bar chart of genus-level differences in fecal fungal populations for all experimental groups (left panel). Comparison of abundance of fecal fungal populations, indicating the 10 most abundant fungi. The right panel shows the abundance of fungal populations determined in groups that were included as age- and gender-matched controls fed chow or were reverted to the chow diet after the HF feeding period to demonstrate the influence of a nonpurified diet on the fungal population. (D) Scatterplots demonstrating the most abundant fungal populations (genus level) present in the fecal samples. No significant differences were observed in Candida or Penicillium as a consequence of diet or fasting protocols. Significance determined by ANOVA. ADF, alternate-day fasting; CR, caloric-restricted; DF, Daniel Fast; HF, high-fat diet; PCoA, principal components analysis; Sqrt, square root; TRF, time-restricted feeding; TSS, total sum scaling.
