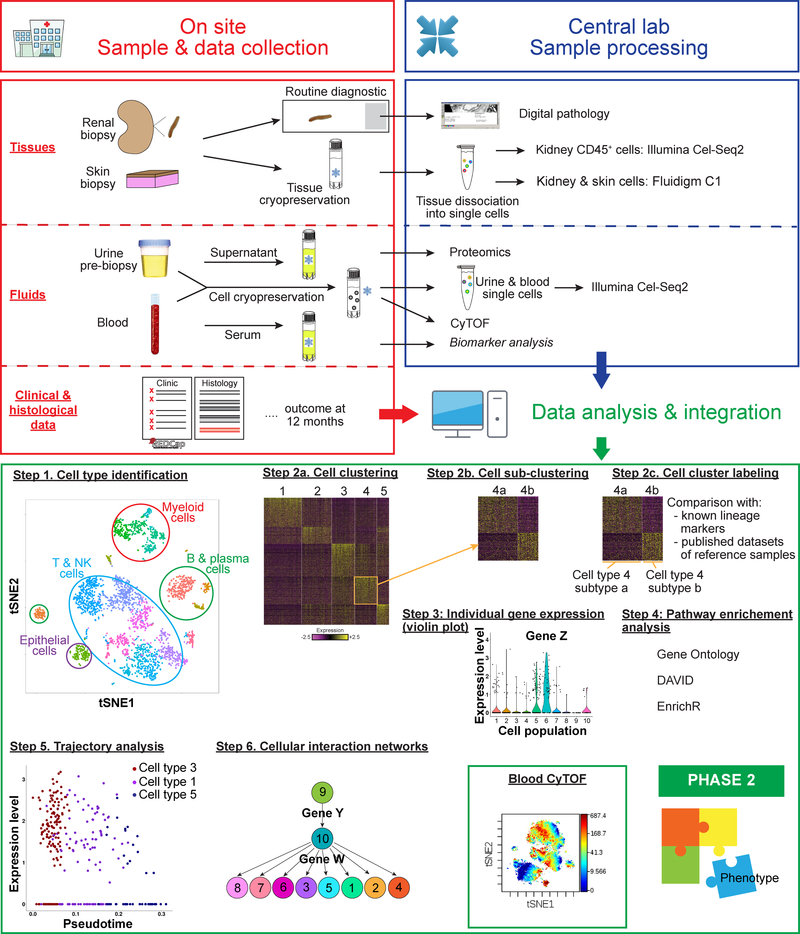
Figure 2: The AMP Lupus Network Pipeline.
Samples and clinical data are collected at point of care (red box). Patient data is loaded into RedCap and samples are processed according to optimized protocols and shipped to the Sample and Tissue Repository for distribution to the technical sites. Proteomic analyses, CYTOF and scRNAseq are each performed at different technical sites (blue box) and data analyses and integration (green box) are performed by the scientific groups. Examples of analyses and integration methods are shown in the bottom panel. Profiled cells are grouped into clusters sharing similar gene expression patterns (Step 1) (19). The dimensionality of the expression data of these genes is reduced using PCA (principal component analysis) and the resulting low-dimensional data analyzed using graph-based clustering (Step 2a). Further subclustering reveals cell subtypes (Step 2b). Cluster labeling is performed by taking into account the distribution of known lineage markers across clusters; the identity of genes specifically upregulated in each cluster; and by comparing the gene expression data of each cluster to those of published datasets of reference samples (Step 2c). Individual gene expression (violin plot) in each cell subtype can be generated (Step 3). Pathway enrichment analysis using curated databases and gene ontology analysis provides information about which genes are active in each pathway (Step 4). Developmental trajectories are constructed by linking cell types to progenitor populations (Step 5) and regulatory relationships can be inferred between genes using cellular interdependency networks (Step 6). Cluster analysis of CyTOF data-displayed as a tSNE plot (Box). Phase 2 will integrate multimodal data to address the goals shown in Figure 1b and to generate hypotheses.

