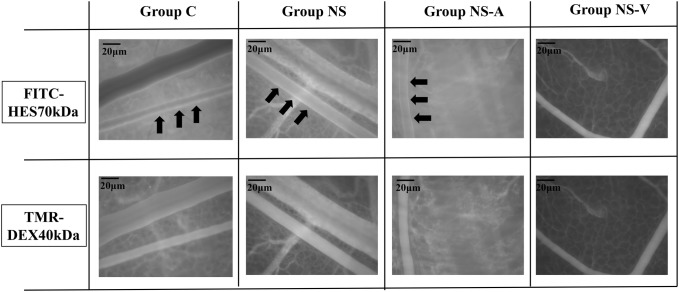
Fig. 8.
Localization of FITC-HES70 in mouse arteries. Representative images at 60 min after blood removal in each group. Fluorescent TMR-DEX40 uniformly stained the intravascular wall in all groups. FITC-HES70 was localized to the intravascular wall (black arrows) in the untreated control (C) group, normal saline administration (NS) group, and normal saline plus albumin administration (NS-A) group, but was uniformly distributed in the normal saline plus HES130 administration (NS-V) group

