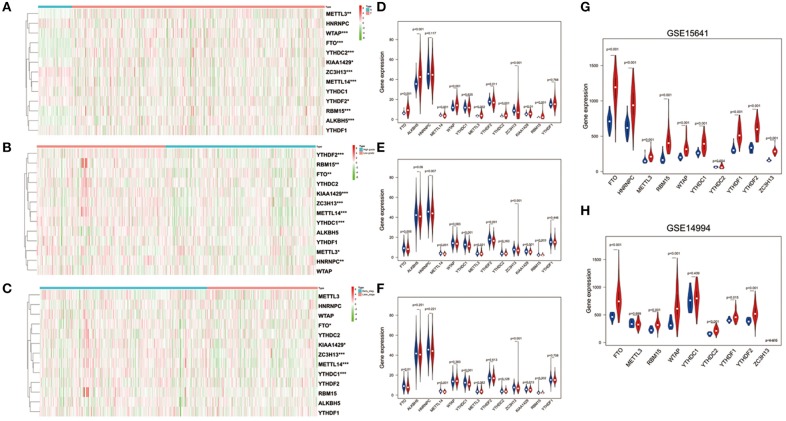
Figure 2.
Expression of m6A RNA methylation regulators in ccRCC with different clinicopathological characteristics. (A–C) The heatmaps of 13 m6A RNA methylation regulators in different tissue samples (A for tumor status, B for WHO grade, and C for pathological stage). (D–F) The expression of 13 m6A RNA methylation regulators in different tissue samples (D for tumor status, E for WHO grade, and F for pathological stage). (G,H) The expression of m6A RNA methylation regulators in tumor tissues and normal tissues (G for GSE15641 and H for GSE14994). *p < 0.05, **p < 0.01, and ***p < 0.001; the red fusiformis represents tumor tissue and the blue fusiformis represents normal tissue.

