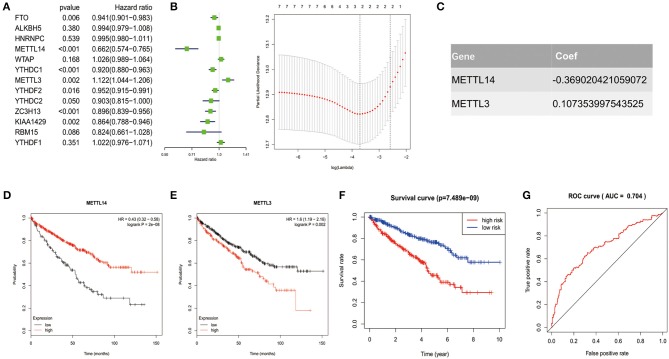
Figure 4.
Risk signature with 2 m6A RNA methylation regulators. (A–C) The process of constructing the signature based on 2 m6A RNA methylation regulators. The Hazard ratio (HR), 95% confidence interval (CI) estimated by univariate Cox regression (A) and the coefficients estimated by multivariate Cox regression via LASSO are presented (B,C). (D,E) The overall survival curves of the two regulators estimated by the Kaplan Meier plotter. Log-rank p < 0.05 was considered statistical significance. HR > 1, gene expression was negatively associated with OS., while HR < 1, gene expression was positively associated with OS. (F) Kaplan-Meier overall survival (OS) curves for patients in high- and low-risk group divided according to the risk score. (G) ROC analysis and AUC value of the ROC curve suggesting the sensitivity and specificity for risk signature.

