Figure 3.
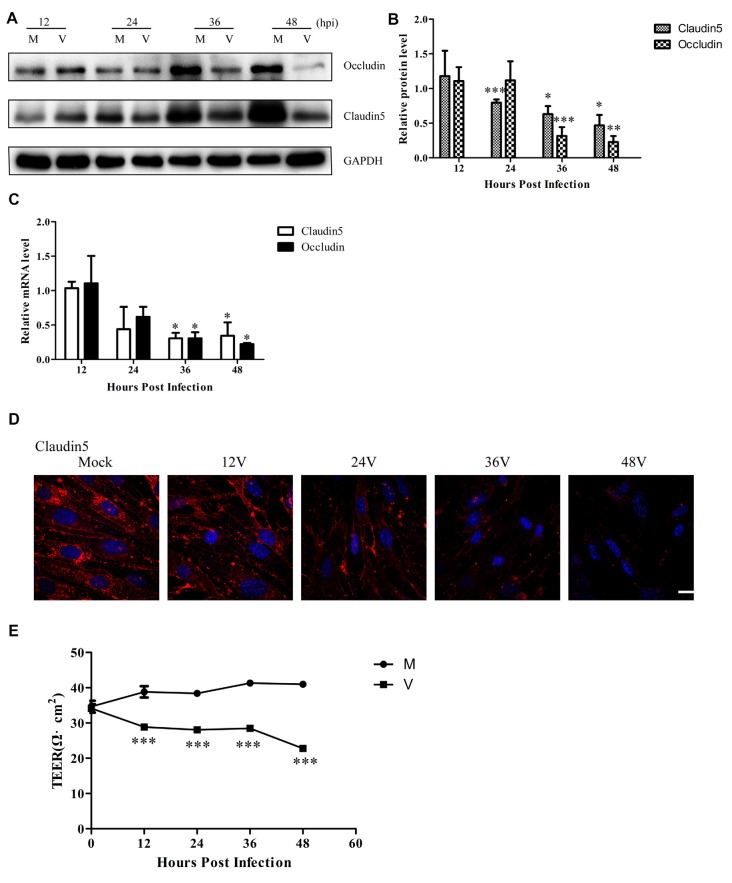
Endothelial cell barrier structure and function disruption after HSV-1 infection. Bend.3 cells were mock-infected (mock) or infected with HSV-1 (V) at an MOI of 3 and harvested at the times indicated. (A) The protein levels of occludin and claudin 5 were downregulated by HSV-1 infection. Occludin and claudin 5 protein levels were determined by immunoblotting and are expressed as fold differences relative to mock-infected cells after normalization to GAPDH levels. GAPDH serves as a loading control. Quantification of (A) is shown in (B). Data are shown as mean ± SD from three independent experiments and were analyzed by the Student’s t-test; *P < 0.05; **P < 0.01; ***P < 0.001. (C) The mRNA levels of occludin and claudin 5 were downregulated by HSV-1 infection. Occludin and claudin 5 mRNA levels were quantified by qRT-PCR and presented as fold differences relative to the levels in mock-infected cells after normalization to GAPDH levels. GAPDH serves as an internal control. Each experiment was performed independently three times. Data are presented as mean ± SD and were analyzed by the Student’s t-test; *P < 0.05. (D) Claudin 5 (red) was detected by immunofluorescence analysis and nuclei were stained with DAPI (blue). Representative images are shown from three independent experiments. Scale bar, 10 μm. (E) Bend.3 monolayer permeability was assessed by TEER measurements. The results show that the barrier function of Bend.3 was disrupted with increasing infection times. Data shown are presented as mean ± SD from three independent experiments and were analyzed by two-way ANOVA. ***P < 0.001.

