Figure 4.
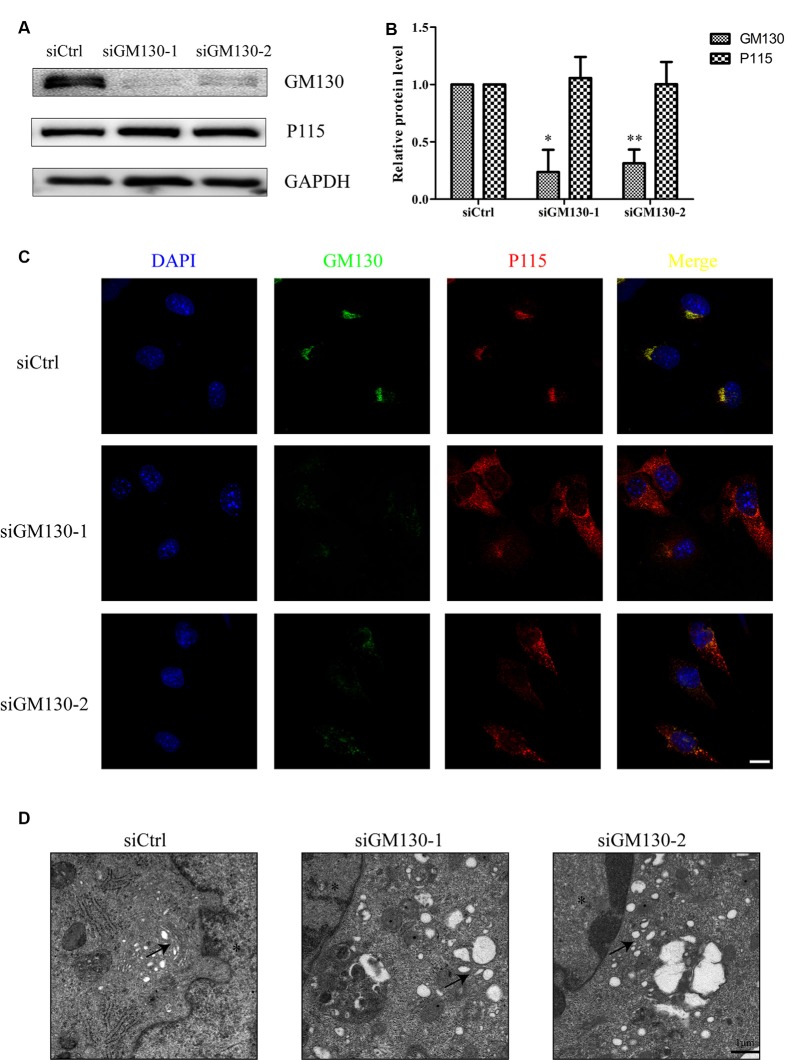
GA fragmentation after knockdown of GM130 in Bend.3 cells. Bend.3 cells were transfected with a negative control small interfering RNA (siCtrl), and two GM130-specific siRNA (siGM130-1, siGM130-2) and harvested at 72 h post-transfection. (A) P115 was not affected by GM130 knockdown. GM130 and P115 protein levels were determined by immunoblotting and presented as fold differences relative to the levels in siCtrl-transfected cells after normalization to GAPDH levels. GAPDH serves as a loading control. Quantification of (A) is shown in (B). Data are shown as mean ± SD from three independent experiments and were analyzed by the Student’s t-test; *P < 0.05; **P < 0.01; (C) GA fragmentation was detected by immunofluorescence assay; transfected cells were immunostained for GM130 (Golgi marker protein, green) and P115 (Golgi marker protein, red). Nuclei were visualized with DAPI. Scale bar, 10 μm. (D) The morphological disruption of the GA was determined by transmission electron microscopy. Representative electron micrographs of Golgi stacks were captured in the negative control group and GM130 knockdown group at 5,000× magnification. Highly ordered and compact Golgi stacks became disordered and dilated-elongated after knockdown (black arrowheads). Representative images are shown from three independent experiments. The asterisk indicates the nucleus. Scale bar, 1 μm.

