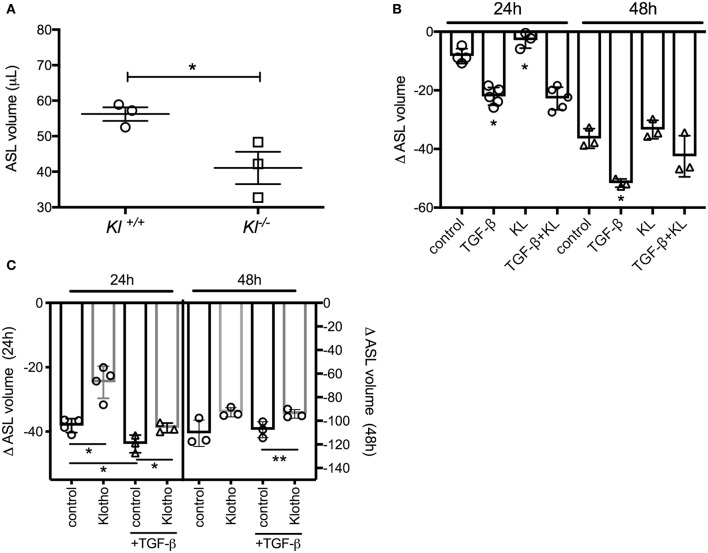
Figure 2.
(A) Dot plot showing a significant decrease of ASL volume in murine tracheal epithelial cells (MTECs), isolated from kl−/− mice and their wild type littermates and using meniscus scanning. (B) Bar graphs indicating ASL volume change in human bronchial epithelial cells (HBEC), differentiated at the ALI interface and treated with TGF-β (2.5 ng/ml) ± recombinant KL (100 ng/ml) for 24 and 48 h. (C) ASL volume change in HBEC, infected with either control or klotho and differentiated at the ALI interface and effect of TGF-β (2.5 ng/ml) for 24 and 48 h. (n = 3 independent experiments showing mean ± S.E. with *P < 0.05 and **P < 0.01).

