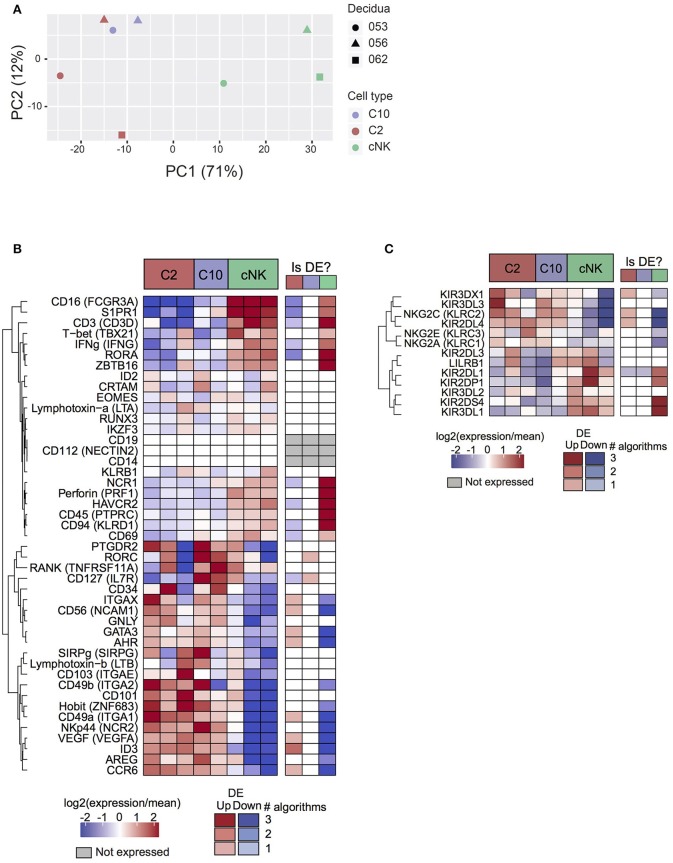
Figure 2.
Transcriptome analysis of C10 and C2. C10, C2, and cNKs were sorted and RNA was isolated and sequenced (n = 3). (A) Principal components analysis of samples by top 500 most varying genes. (B) Expression levels of genes of interest (cell sorting panel and canonical ILC genes) from C2, C10, and cNKs. (C) Expression levels of KIRs across C2, C10, and cNKs. Whether the gene is called differentially expressed is indicated in the right-hand column, shaded by confidence (number of agreeing DE algorithms). See Data Sheet 2.

