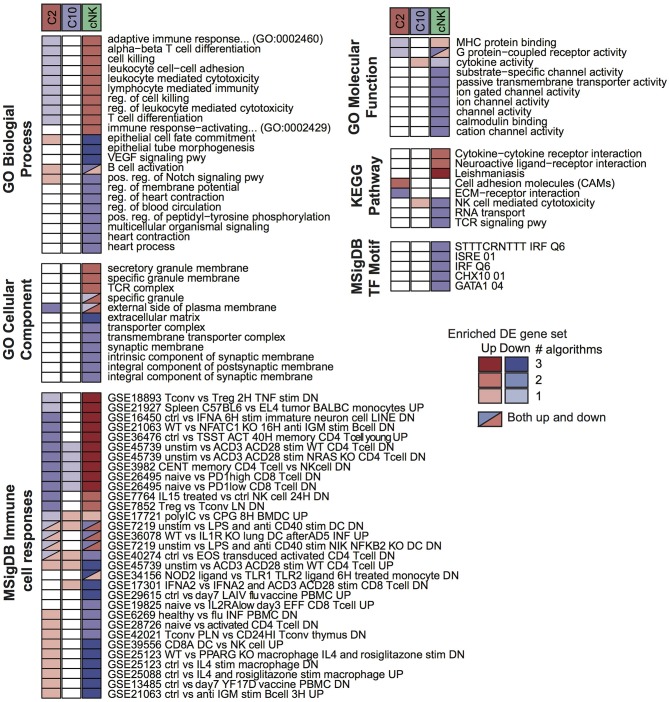
Figure 3.
Pathway enrichment analysis of differentially expressed (DE) gene sets. Up- and down-regulated DE gene sets were called for C2, C10, and cNK by comparing each cell type to the other two using three different algorithms (Materials and Methods, “Differential expression analysis”). For each DE gene set and each of six pathway databases from GO, KEGG, and MSigDB, GOSeq was applied to identify pathways that were overrepresented in the DE gene set relative to all annotated genes in the database. Shown are the union of the top 5 terms per gene set and database, filtered to include those identified for at least two cell types or by at least two algorithms. Color indicates the sign of the DE gene set (up/down) and shading indicates the number of DE algorithms for which the pathway was identified.

