Figure 6.
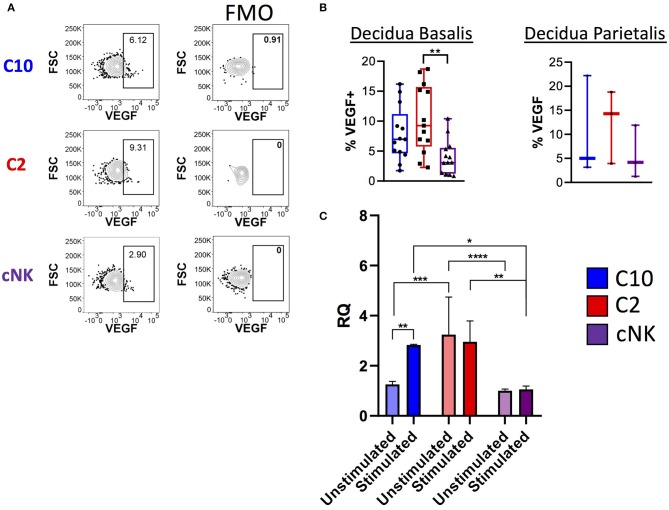
Production of VEGF by novel ILCs C10 and C2. Lineage Negative (CD3, CD14, CD19), CD34−CD45+ cells were activated with PMA/Ionomycin for 6 h. (A) Left, Representative gating scheme of C10, C2, and cNK showing VEGF production. Right, Fluorescence minus one control for VEGF staining. (B) Quantification of VEGF production by C10, C2, and cNK. Decidua basalis, n = 13; decidua parietalis, n = 3. Data represented as max/min, median, and 25 and 75th percentiles. Statistical significance was determined by ANOVA, followed by Tukey post-hoc tests. **p < 0.005. (C) Sorted C10, C2, and cNKs cells from the decidua were stimulated with cytokines (IL-12/IL-15/IL-18) for 24 h, then processed for RNA extraction, followed by qPCR analysis. Data represented as mean ± SEM Statistical significance was determined by 2- way ANOVA, followed by Tukey post-hoc tests. *p < 0.05, **p < 0.005, ***p < 0.0005, ****p < 0.00001. Unstimulated, n = 4; stimulated, n = 2. For statistical details see Supplementary Tables 7, 8. Data is provided in Data Sheet 1.

