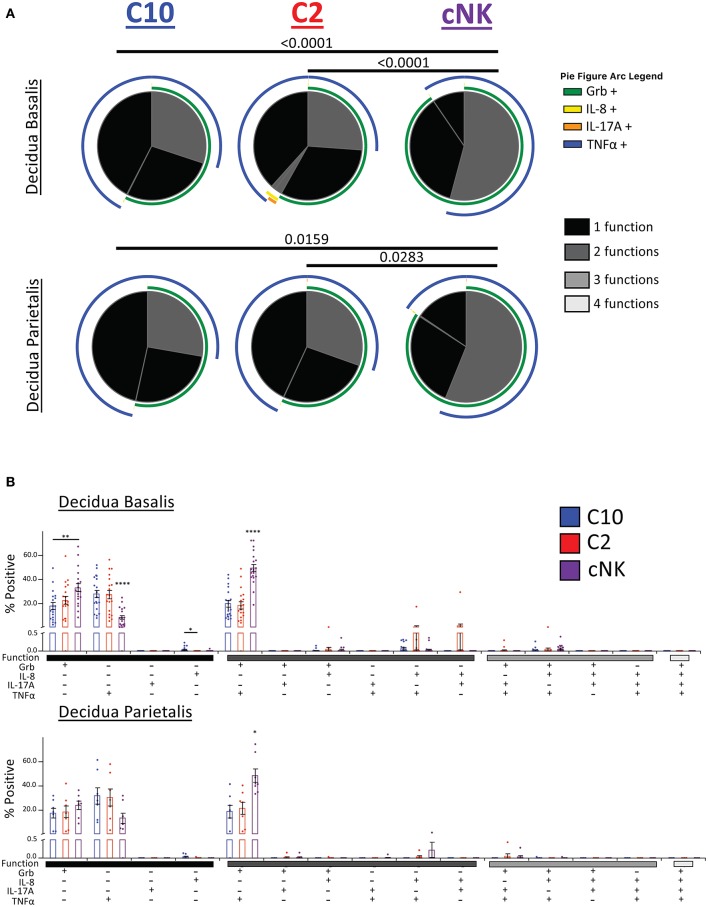
Figure 9.
Activation of C10 and C2 ILCs with PMA/Ionomycin Reveals Preference for TNFα. Activation of C10 and C2 led to a higher proportion of TNFα+ cells compared to cNKs. Decidua basalis, n = 19; decidua parietalis, n = 7. Data represented as mean ± SEM. Statistical significance was determined by ANOVA followed by Tukey test. *p < 0.05, **p < 0.005, ****p < 0.0001. For statistical details see Supplementary Table 13. Data is provided in Data Sheet 1.

