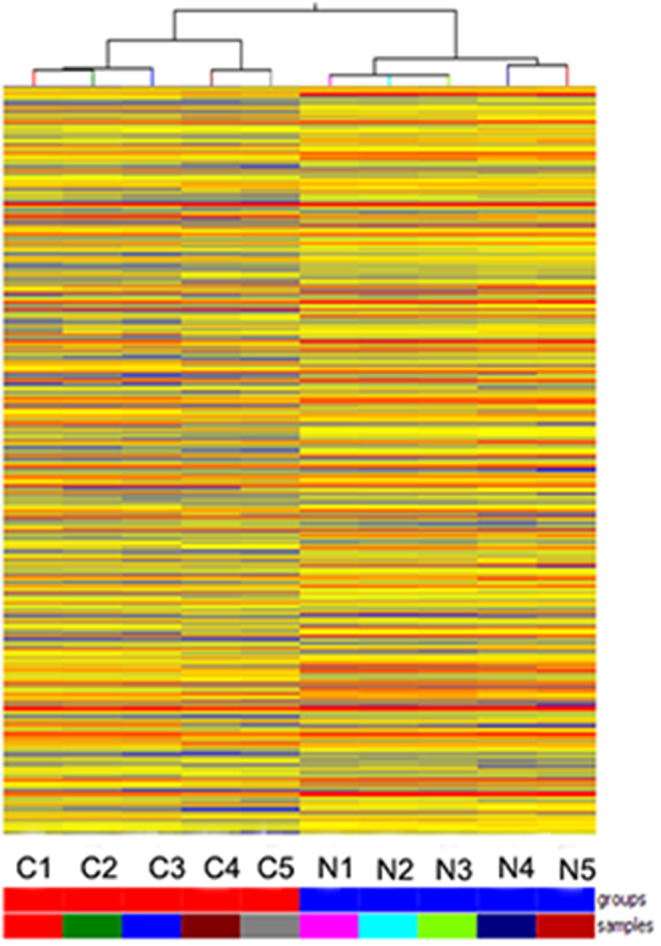
Figure 1.

Hierarchical clustering is shown as a heat map, and 1,066 differently expressed lncRNA levels are shown in color scales (Red indicates high relative expression, and blue indicates low relative expression). Columns C1–C5 are five different SNSCC samples, and columns N1–N5 represent the corresponding non-cancerous tissues.
