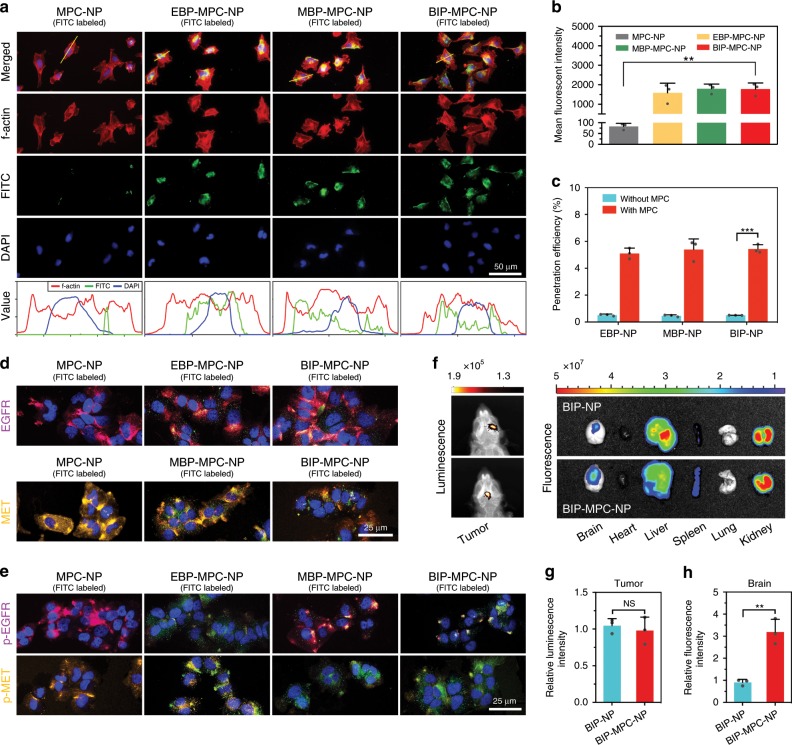
Fig. 2. The biological activity of nanoinhibitors.
a The fluorescence assays showed the localization of EBP-MPC-NP, MBP-MPC-NP or BIP-MPC-NP on the LN229R cell surface. The gray value was displayed in line plots. Scale bar = 50 μm. b The flow cytometric analysis of cells with MPC-NP, EBP-MPC-NP, MBP-MPC-NP or BIP-MPC-NP in vitro (n = 3). c The transportation assays showed the permeability of EBP-MPC-NP, MBP-MPC-NP and BIP-MPC-NP in vitro (n = 3). d The binding affinity of MPC-NP, EBP-MPC-NP, MBP-MPC-NP or BIP-MPC-NP after penetrating BBB models. Scale bar = 25 μm. e The IF assays showed the attenuation of p-EGFR and p-MET by administration of MPC-NP, EBP-MPC-NP, MBP-MPC-NP or BIP-MPC-NP in BBB model. Scale bar = 25 μm. f Ex vivo fluorescence and bioluminescence images of the visceral organs after the injection of BIP-NP or BIP-MPC-NP in mice. g, h The histogram summarized the relative luminescence intensity and the relative fluorescence intensity of tumor-bearing brains. The error bars in b, c, g and h represent the S.D. of three measurements (n = 3). P value is determined by Student’s t-test. Significant results are presented as NS non-significant, **P < 0.01, or ***P < 0.001.

