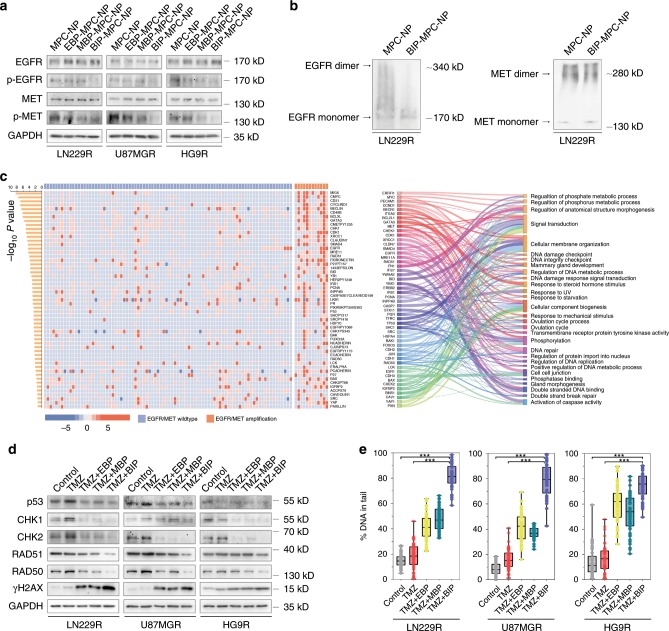
Fig. 3. BIP-MPC-NP inhibits DNA damage repair via the mitigation of EGFR and MET signaling pathways.
a The EGFR, p-EGFR, MET and p-MET expression in TMZ-resistant glioma cells treated with different nanoinhibitors. b The levels of EGFR and MET dimers in TMZ-resistant glioma cells treated with BIP-MPC-NP. c The heatmap displayed the differential expressed proteins between GBM patients with low EGFR and MET copy numbers group and with high EGFR and MET copy numbers group. The Sankey diagram displayed the Gene Ontology of the differentially expressed proteins. d The inhibition of DNA damage repair modules expression and the increase of γH2AX expression with the treatments of TMZ and different nanoinhibitors in LN229R, U87MGR and HG9R. e The boxplots showing the statistics of comet assay of TMZ-resistant glioma cells with TMZ and different nanoinhibitors (n = 50). In the box plots, bounds of the box spans from 25 to 75% percentile, center line represents median, and whiskers visualize minimum and maximum of the data points. P value is determined by Student’s t-test. Significant results are presented as ***P < 0.001.

