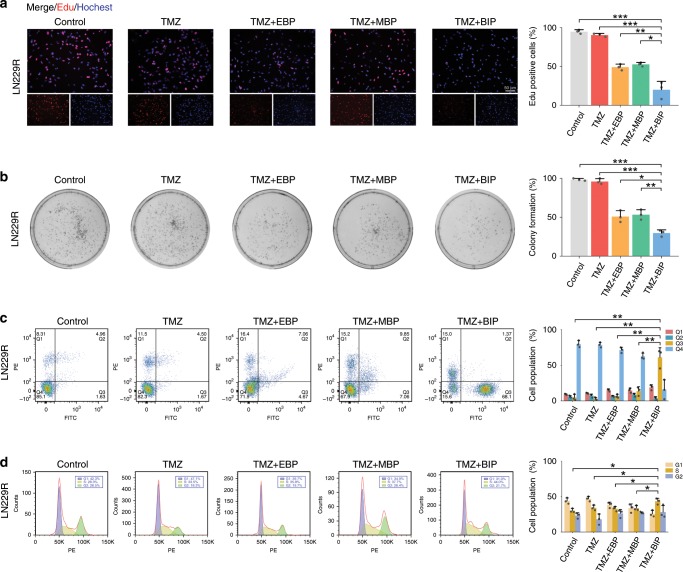
Fig. 4. The TMZ sensitivity enhanced by BIP-MPC-NP in LN229R cells.
a, b The EdU assay and colony formation assay of LN229R with treatments of TMZ and different nanoinhibitors. The histogram displayed the statistics of EdU assay and colony formation assay, respectively (n = 3). Scale bar = 50 μm. c, d The cell apoptosis assay and the cell-cycle analysis were performed with flow cytometry in LN229R. The histogram displayed the statistics of apoptosis assay and the cell-cycle analysis, respectively (n = 3). The error bars represent the S.D. of three measurements. P value was determined by Student’s t-test. Significant results are presented as *P < 0.05, **P < 0.01, ***P < 0.001.

