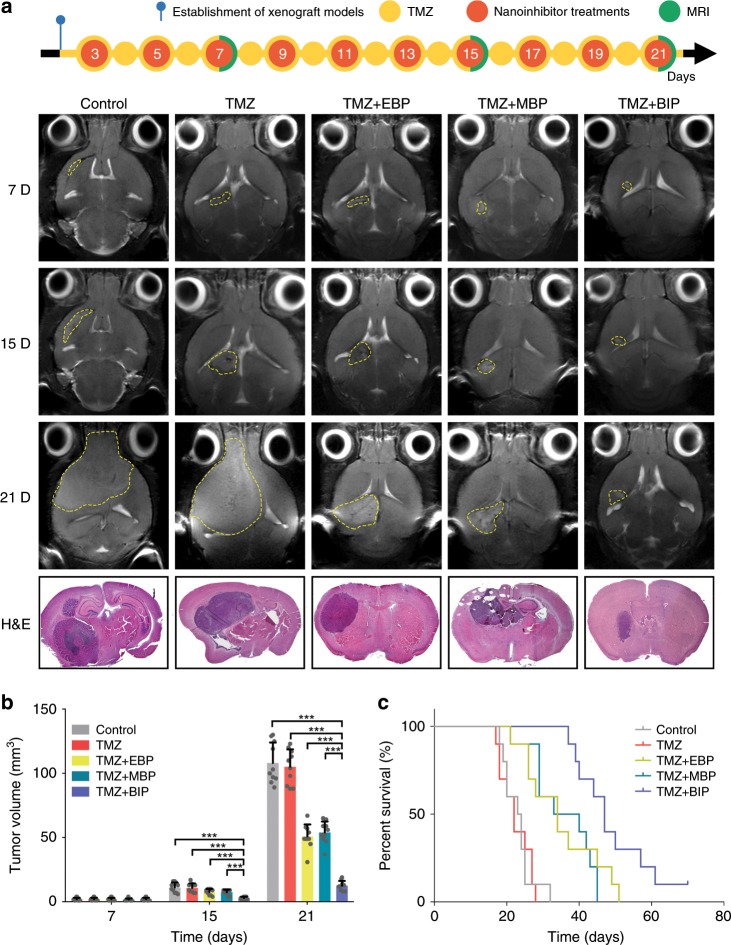
Fig. 6. The therapeutic response of BIP-MPC-NP combined with TMZ in xenografts tumor derived from TMZ-resistant glioma cells.
a The diagram showed the process of the establishment of models, drug administration and MRI scan. T2-weighted MR images of mouse head at selected times post treatment with TMZ and different nanoinhibitors. The tumor sizes were visualized by H&E staining image. b Tumor volumes were measured on selected days post tumor implantation (n = 10). c Kaplan–Meier survival curves of mouse models after corresponding treatments (n = 10). P = 4.33E−10 for the four groups. Control vs TMZ, P = 9.04E−01; Control vs TMZ + EBP, P = 4.22E−04; Control vs TMZ + MBP, P = 3.40E−04; Control vs TMZ + BIP, P = 4.00E−06; TMZ vs TMZ + EBP, P = 4.13E−02; TMZ vs TMZ + MBP, P = 6.20E−05; TMZ vs TMZ + BIP, P = 4.00E−06; TMZ + EBP vs TMZ + MBP, P = 1.57E−01; TMZ + EBP vs TMZ + BIP, P = 1.32E−02; TMZ + MBP vs TMZ + BIP, P = 4.82E−03. The error bars in b represent the S.D. of ten measurements. P value is determined by Student’s t-test or log-rank test. Significant results are presented as *P < 0.05, **P < 0.01 or ***P < 0.001.

