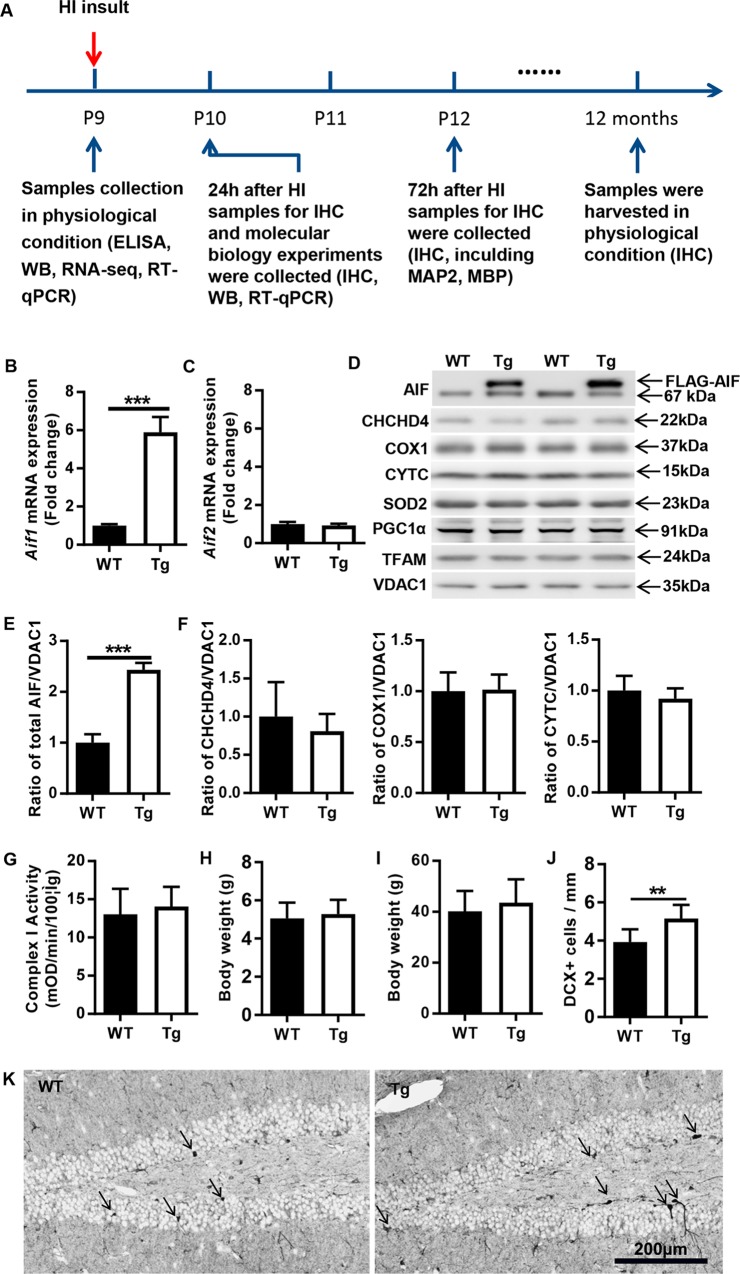
Fig. 1. Expression of mitochondria-related proteins in P9 AIF Tg mice under physiological conditions.
a The timeline for the entire study, including sample collection time points and the experiments that were performed at different time points. b Aif1 mRNA expression was upregulated in AIF Tg mice compared to WT mice at P9 under physiological conditions (5.89 ± 0.80 vs. 1.00 ± 0.08, n = 6/group, ***p < 0.001). c Aif2 mRNA expression was not significantly different between WT and AIF Tg mice at P9 (1.00 ± 0.11 vs. 0.93 ± 0.09, n = 6/group, p = 0.227). d Representative immunoblots of the mitochondrial fraction from cortical tissue of P9 WT and AIF Tg mice. A greater amount of exogenous AIF (upper band of AIF) than endogenous AIF (lower band of AIF) was seen in the AIF Tg mice. e Total AIF protein expression in AIF Tg mice (two bands) was dramatically increased compared to WT mice (one band) (2.44 ± 0.13 vs. 1.00 ± 0.17, respectively, n = 6/group, ***p < 0.001), but there was no significant difference in endogenous AIF expression (1.08 ± 0.14 vs. 1.00 ± 0.31, respectively, n = 6/group, p = 0.5577). f Semi-quantification of some mitochondria-related proteins (CHCHD4, COX1, CYTC, and SOD2) did not show any significant differences between WT and AIF Tg mice under physiological conditions (n = 6/group). g OXPHOS complex I activity was determined in the mitochondrial fraction of cortical tissue of P9 WT and AIF Tg mice, and no significant difference was found (13.04 ± 3.32 vs. 14.05 ± 2.58, n = 6/group, p = 0.5677). h The body weight of P9 mouse pups was not significantly different between WT and AIF Tg mice (5.06 ± 0.82 g vs. 5.28 ± 0.74 g, respectively, n = 54/group, p = 0.1407). i The body weight at one year of age was not significantly different between WT and AIF Tg mice (40.18 ± 8.04 g vs. 43.61 ± 9.13 g, respectively, n = 8 in WT mice, n = 13 in AIF Tg mice, p = 0.393). j The DCX-positive cell density in the granular layer of the dentate gyrus of AIF Tg mice was significantly higher than WT mice at one year of age (3.93 ± 0.66 cells/mm vs. 5.15 ± 0.71 cells/mm, n = 8 in WT mice, n = 6 in AIF Tg mice, **p < 0.01). k Representative pictures of DCX staining in dentate gyrus regions in WT and AIF Tg mice at one year of age. Black arrows indicate the positive cells.

