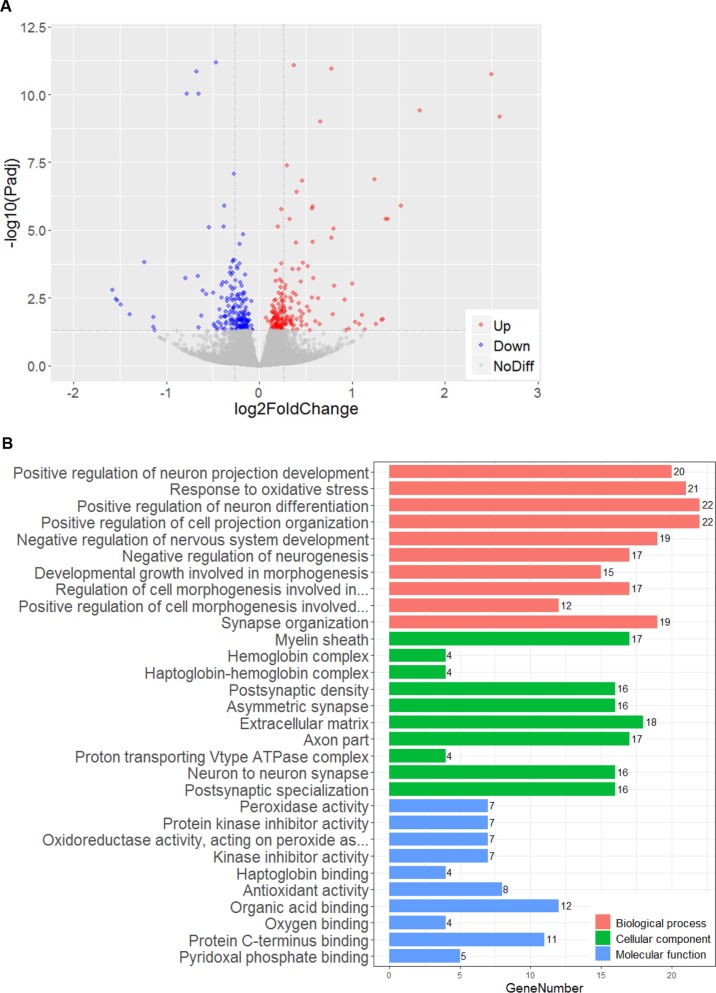
Fig. 2. AIF overexpression had no significant impact on the transcriptome in the cortex of P9 mice.
a Volcano plot showing DEGs between WT male mice and AIF Tg male mice (n = 6/group). The negative log10-transformed adjusted p-values (Padj) test the null hypothesis of no difference in expression levels between WT and AIF Tg male mice (Y-axis) and are plotted against the average log2 fold changes in the expression (X-axis). Non-significantly expressed genes are plotted in grey (p < 0.05 was used for the filter and is indicated by the dashed line parallel with X-axis). Significantly upregulated and downregulated genes are plotted in red and blue, respectively (369 out of 21,762 genes in total, with 183 genes upregulated and 186 genes downregulated). The two dashed lines parallel with the Y-axis indicate an absolute log2 fold change equal to 0.2. b Top ten classified GO terms in three ontologies. GO classification was performed based on the DEGs (369 genes in total). The X-axis represents the number of DEGs, and the Y-axis represents the GO terms.

