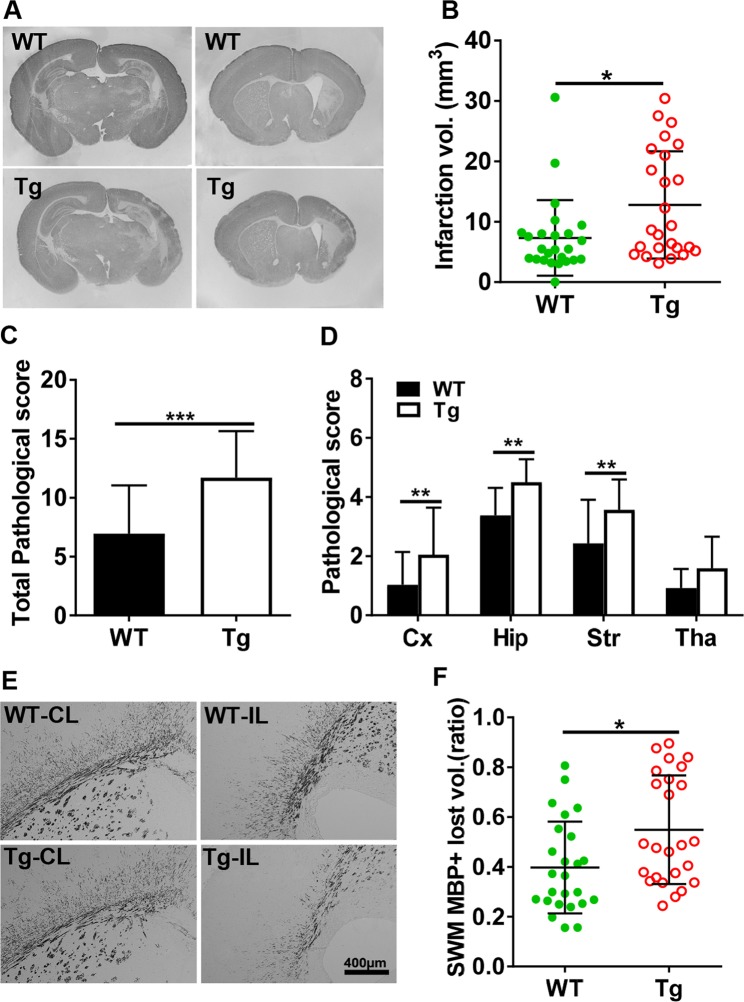
Fig. 3. AIF overexpression increased brain injury after HI.
a Representative MAP2 staining of coronal brain sections 72 h after HI at the levels of the dorsal hippocampus (left panels) and striatum (right panels) from WT and AIF Tg mice. b The infarction volume was measured at 72 h after HI in WT and AIF Tg mice (7.32 ± 6.25 mm3 vs. 12.78 ± 8.89 mm3, respectively, n = 25/group, including 14 males and 11 females. *p < 0.05). c The total pathological score was evaluated at 72 h after HI in WT and AIF Tg mice (6.96 ± 4.10 vs. 11.70 ± 3.95, respectively, n = 25/group, ***p < 0.001). d The pathological scores were evaluated in different brain regions in WT and AIF Tg mice, including the cortex (Cx, 1.03 ± 1.11 vs. 2.05 ± 1.59, respectively, **p < 0.01), hippocampus (Hip, 3.38 ± 0.93 vs. 4.50 ± 0.77, respectively, **p < 0.01), striatum (Str, 2.43 ± 1.48 vs. 3.56 ± 1.03, respectively, **p < 0.01), and thalamus (Tha, 0.92 ± 0.64 vs. 1.59 ± 1.07, respectively, p = 0.1356). e Representative MBP staining of coronal brain sections revealed the myelin structure in the subcortical white matter of the CL and IL hemispheres at 72 h after HI. f Quantification of the tissue loss ratio in the subcortical white matter (SWM) showed more white matter loss in AIF Tg mice than in WT mice at 72 h after HI (0.55 ± 0.22 vs. 0.40 ± 0.18, respectively, n = 25/group, including 14 males and 11 females. *p < 0.05).

