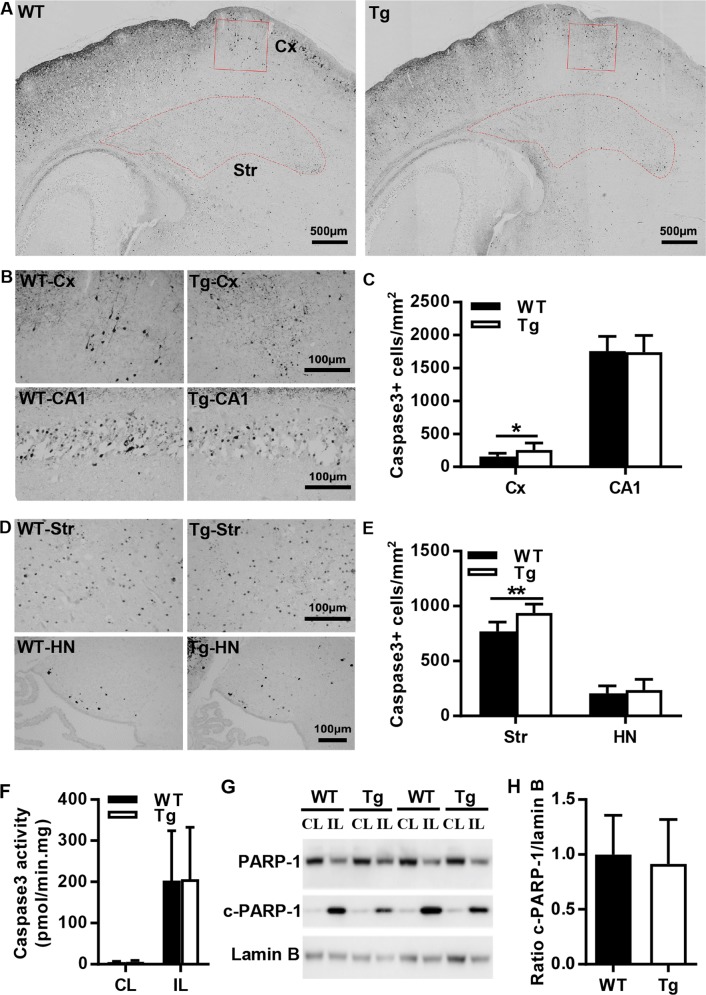
Fig. 5. AIF overexpression increased active caspase-3–positive cells in parts of the mouse brain after HI.
a Representative active caspase-3 staining in the cortex and striatum regions in WT and AIF Tg mice at 24 h post-HI. b Higher magnification of active caspase-3 staining images showing the active caspase-3-positive cells in the cortex (Cx) (upper panels) and hippocampal CA1 area (lower panels) in WT and AIF Tg mice at 24 h post-HI. c Quantification of active caspase-3-positive cells in WT and AIF Tg mice at 24 h after HI in the cortex (156.1 ± 50.6 cells/mm2 vs. 254.3 ± 106.7 cells/mm2, 95% CI 1.0–195.4, respectively, n = 7/group, *p < 0.05) and CA1 (1758.3 ± 219.5 cells/mm2 vs. 1,739.8 ± 252.7 cells/mm2, 95% CI −272.3–235.3, respectively, n = 8/group) area. d Higher magnification of active caspase-3 staining showing the active caspase-3-positive cells in the striatum (Str) (upper panels) and habenular nuclei (HN) (lower panels) in WT and AIF Tg mice at 24 h post-HI. e Quantification of active caspase-3-positive cells in WT and AIF Tg mice at 24 h after HI in the striatum (770.4 ± 85.5 cells/mm2 vs. 938.1 ± 80.3 cells/mm2, 95% CI 78.8–256.7, respectively, n = 8/group, **p < 0.01) and habenular nuclei (205.7 ± 69.6 cells/mm2 vs. 235.5 ± 97.9 cells/mm2, 95% CI −61.4–120.9, respectively, n = 8/group). f The caspase-3 activity in the cortical tissue was measured at 24 h after HI. The activity was increased dramatically in the IL hemisphere, but there was no significant difference between WT and AIF Tg mice (n = 6/group). g Immunoblotting of PARP-1 and cleaved PARP-1 in the nuclear fraction from the cortical tissue of the CL and IL hemispheres at 24 h after HI in WT and AIF Tg mice. Lamin B was used as the loading control. h Quantification of PARP-1 and cleaved PARP-1 did not show any significant difference between WT and AIF Tg mice after correction for the loading control (n = 5/group).

