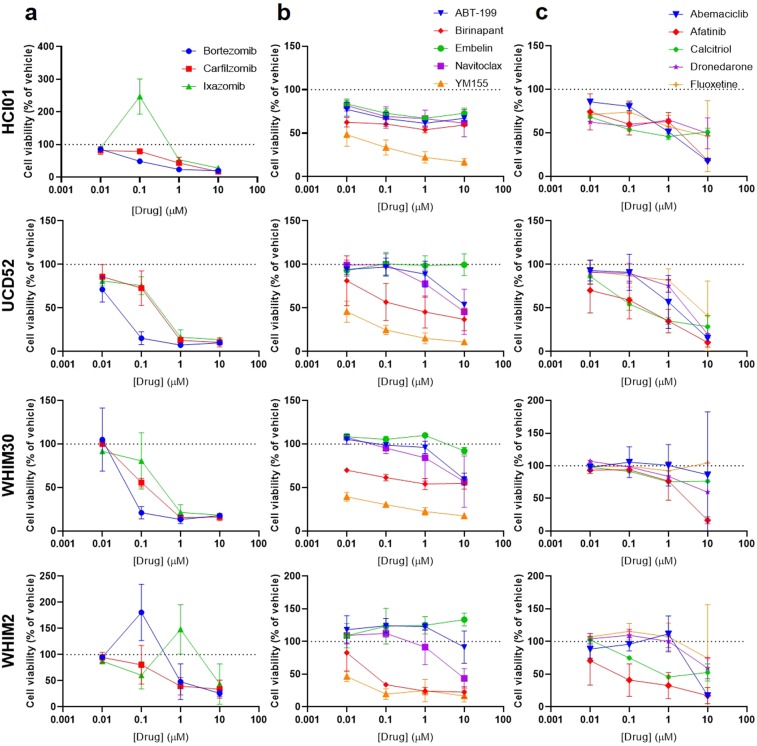
Figure 3.
Dose responses of basal-like TNBC PDXs to selected classes of targeted therapeutics. Graphs depict cell viability (percent of vehicle) in response to increasing concentrations of the indicated drugs for each of four basal-like PDX lines (HCI01, UCD52, WHIM30, WHIM2): (a) proteasome inhibitors (carfilzomib, bortezomib, ixazomib); (b) drugs targeting apoptosis pathways (YM155, navitoclax, ABT-199, embelin, birinapant); and (c) EGFR inhibitor (afatinib), CDK4/6 inhibitor (abemaciclib), SSRI (fluoxetine), synthetic vitamin D3 (calcitriol), antiarrhythmic (dronedarone). Experiments were performed in triplicate. Error bars represent standard deviation between independent experiments. p-values are listed in Supplementary Table S1.

