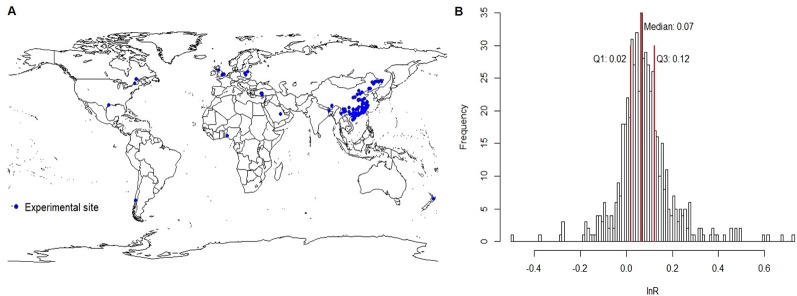
Figure 1.
The Map distribution of experimental sites (A) and frequency distribution of data indicating effects of Mg fertilization on crop yield (B) for our meta-analysis. The blue spots indicated local experimental sites of Mg fertilizers in the field (A). The three red lines of Q1 (left), Median (middle), and Q3 (right) corresponded to data frequency 25%, 50%, and 75% (B).

