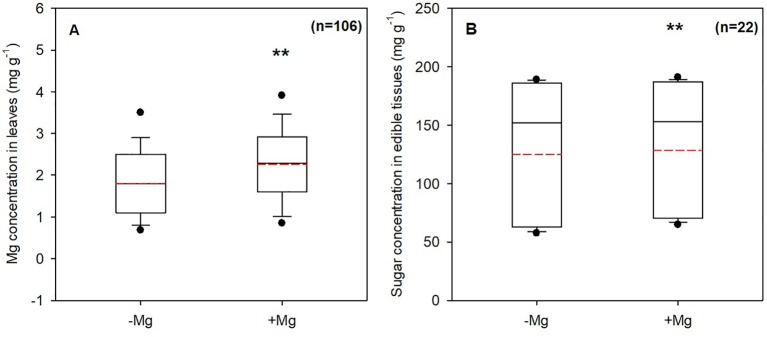
Figure 3.
Mg in leaves (A) and sugar in edible tissues (B) concentrations with Mg (+Mg) and without Mg (-Mg) supplementation. Solid black and dashed red lines indicated the median and mean, respectively. The box boundaries indicated the 75% and 25% quartiles; error bars indicated the 90th and 10th percentiles; and the black dots indicated the 95th and 5th percentiles. **, indicated highly significant differences between treatments (P < 0.01).

