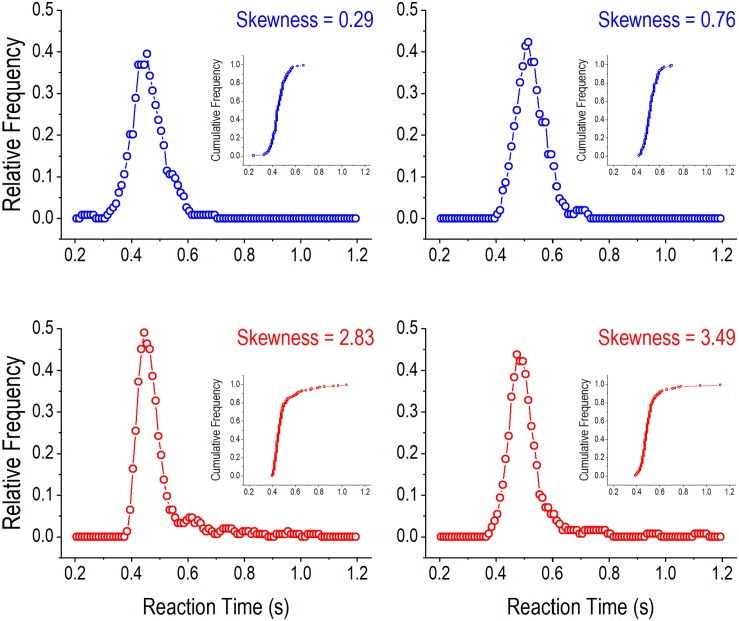
FIGURE 3.
Illustration of reaction time (RT) distributions in the 2-choice reaction time task. The four panels show relative frequency distributions of RT in four rats when the hold time was greater than 4 s. In the upper panels (with blue curves), the smaller skewnesses of RT distributions are associated with shorter tails on the right side of the distribution curves. In contrast, in the lower panels (with red curves), the greater skewnesses of RT distributions are associated with longer tails on the right side of the distribution curves. One dot in an RT distribution curve represents the relative running frequency for a 50-ms bin (e.g., 200–250, 210–260, and 220–270 ms). The inserts are cumulative frequency distribution curves of RT in the four rats.

