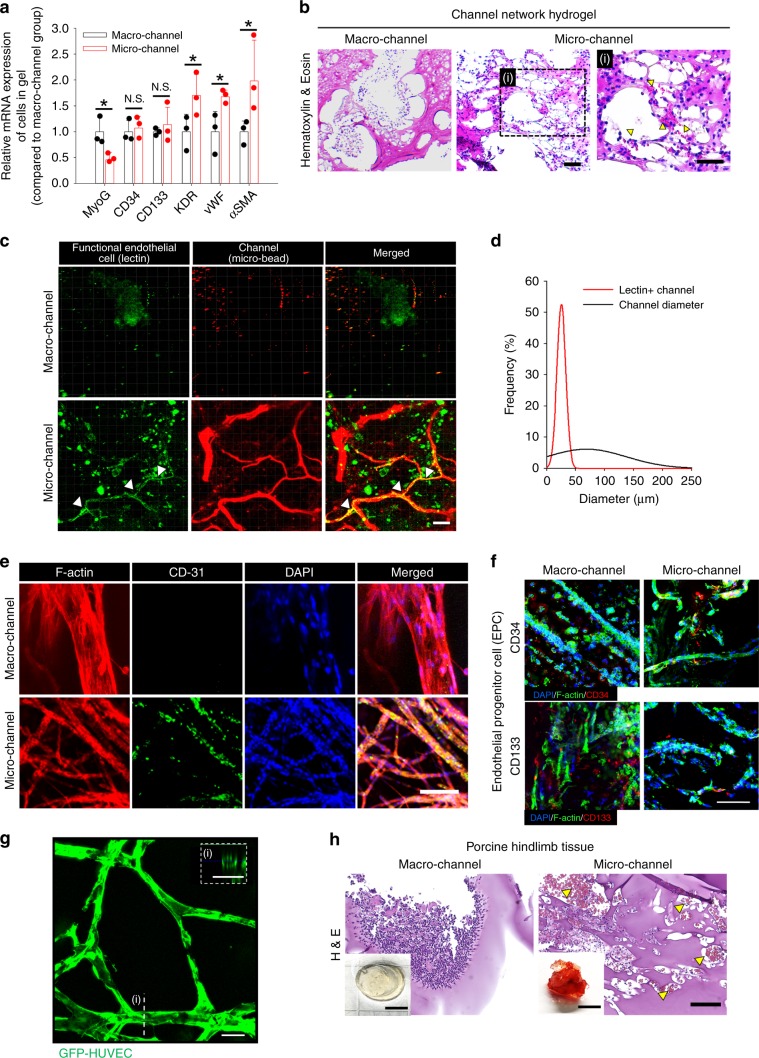
Fig. 4. In vivo infiltration and ingrowth of ECs within channel network hydrogels.
EC infiltration and ingrowth within channel network hydrogels from 2-week implantation in mouse (a–f) and porcine (h) models of hindlimb ischemia. a Gene expression of infiltrated cells between macro- and microchannel groups at day 14 post-implantation (N = 3). Dots represent each replicate. Data presented in mean ± SEM. Statistical significances are determined using two-tailed Student’s t-test; *p < 0.05 between lined groups (N.S.: not significant). b H&E images of implanted channel network hydrogels. In the box with high magnification (right, i), yellow arrows indicate sites where blood cells infiltrated the microchannel network hydrogel. Scale bar = 100 µm. c Confocal images of functional ECs (lectin+), in macro- and microchannel groups and d quantitative analysis of lectin+ channel size distribution. The images were obtained from whole-mount hydrogels post-EC staining (green, lectin) and channel perfusion (red, microbeads). Scale bar = 100 µm. White arrows indicate co-localization of functional ECs (green) and perfusion-stained channel (red). e Confocal images of whole-mount hydrogel with macro- or microchannel network post co-immunostaining of CD31 (green), F-actin (red), and nucleus (blue). Scale bar = 100 µm. f Confocal images of whole-mount hydrogel with macro- or microchannel network post co-immunostaining of CD34/CD133 (red) and F-actin (green) with nucleus (blue). Scale bar = 100 µm. g Confocal image of ECs (GFP-HUVEC) lining a microchannel network in vitro (i: a cross-sectionaview of EC-lined channel). Scale bar = 100 µm. h H&E images of implanted channel network hydrogels in porcine hindlimb ischemia. Yellow arrows indicate the sites where blood cells infiltrated in the microchannel group. Scale bars = 5 mm for digital images and 100 µm for H&E images. Source data are provided as a Source Data file.

