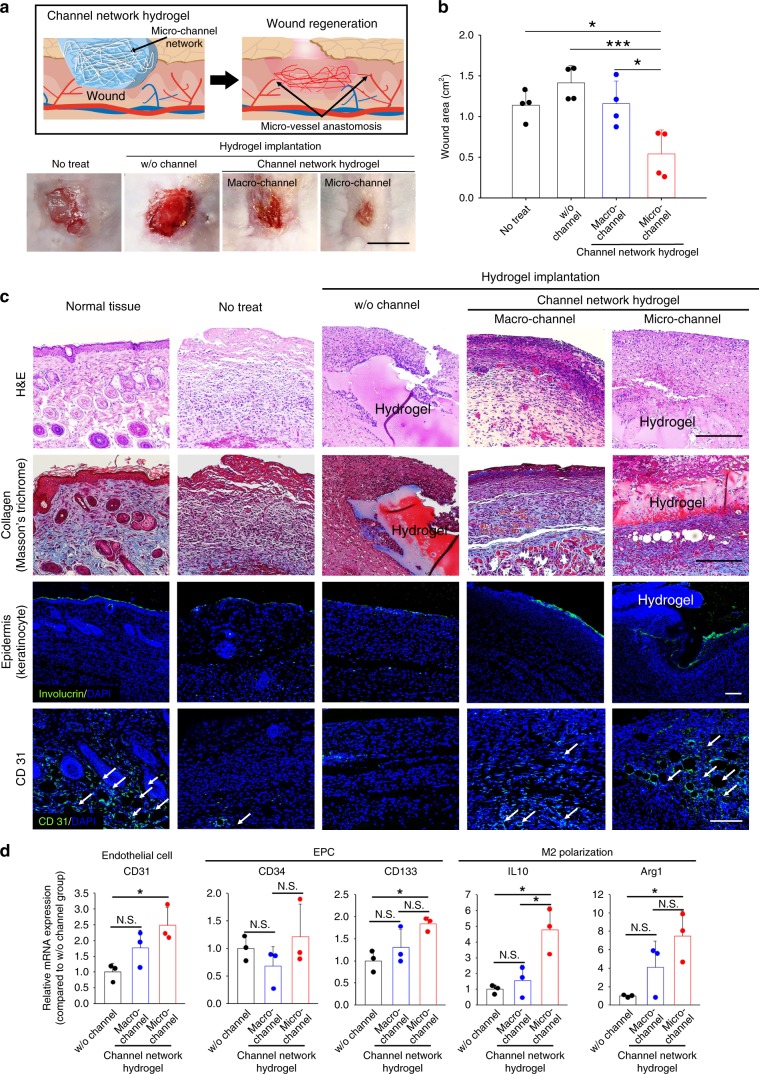
Fig. 5. Regenerative effects of test hydrogels on wound closure.
a Schematic illustration of hydrogel implantation into a wound site post-full-thickness defect of mouse dorsal skin with the discovered regeneration process (top box). Photographs of wound healing sites at day 14 post-implantation (bottom row). Scale bar = 1 cm. b Degrees of decreased wound area from the initial 2 × 2 cm defect in each group at day 14 post-implantation (N = 4). Dots represent each animal. Data are presented as mean ± SEM. Statistical significances are determined using one-way ANOVA with Tukey post-hoc pairwise comparisons; *p < 0.05 and ***p < 0.005 between lined groups. c Representative images of general histology (H&E), collagen formation (Masson’s trichrome), keratinocyte-epidermis lining (green Involucrin), and CD31+ cells (green) with nuclei (blue DAPI). White arrows point out microvascular structures (CD31+) in the skin tissue sections. Scale bar = 100 µm. d Marker gene expression of EC (CD31), EPC (CD34 and CD133), and M2 polarization (IL10 and Arg1) in the wound area of mouse dorsal skin at day 14 post-implantation by qRT-PCR (N = 3). Dots represent each animal. Data are presented as mean ± SEM. Statistical significances are determined using one-way ANOVA with Tukey post-hoc pairwise comparisons; *p < 0.05 between lined groups (N.S.: not significant). Source data are provided as a Source Data file.

