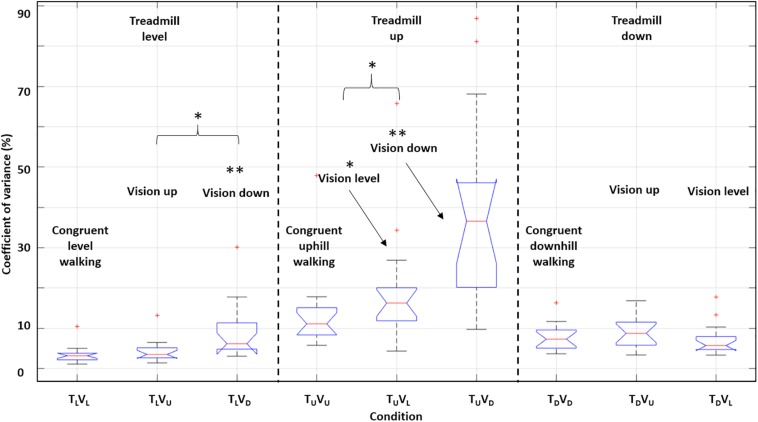
FIGURE 10.
Impact on the coefficient of variance of walking speed induced by incongruent sensory information. Boxplots depicting coefficient of variance of walking speed during the first 20 s post-transition. For each boxplot, the central red line indicates the median, and the upper and lower edges indicate interquartile range. Outliers are plotted using red ‘+’ symbols. Here we marginalized according to the treadmill inclination. Vision down led to more variable gait in conditions with treadmill level and up. There were no differences across conditions with treadmill down. For each treadmill inclination, paired t-tests (two-tailed) were run between each incongruent condition and the congruent condition, and between the two incongruent conditions. ∗P < 0.05, ∗∗P < 0.01. Asterisks that appear without a brace indicate comparison to the corresponding congruent condition.

